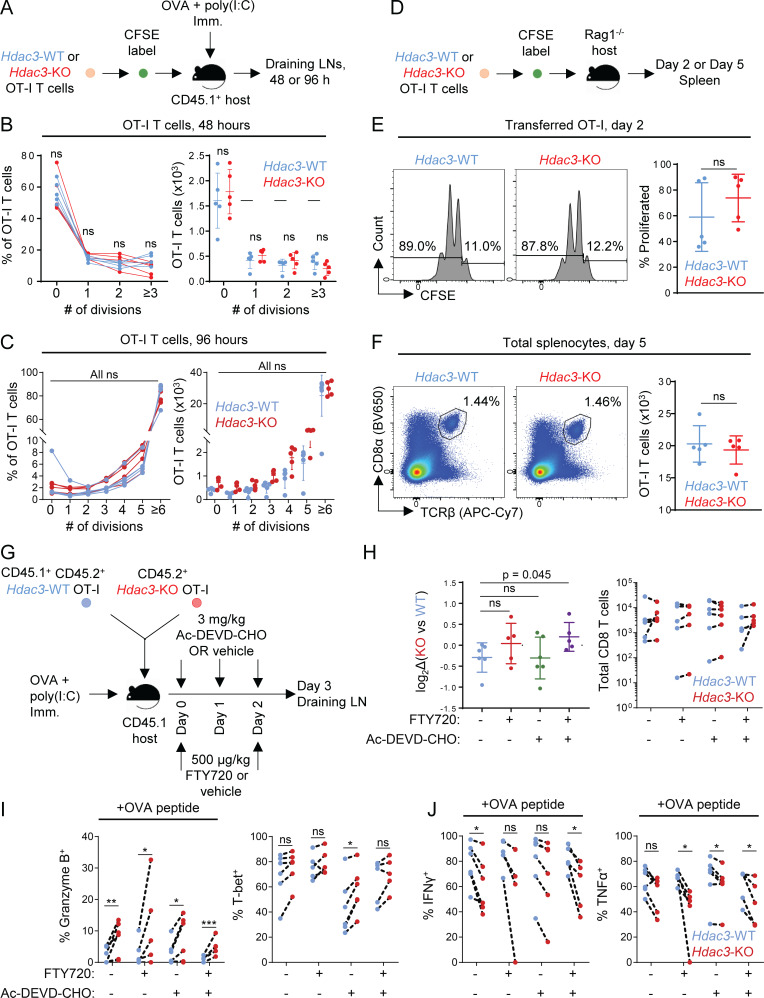
Figure S4.
Analysis of reduced accumulation of Hdac3-KO CD8 T cells in draining LNs after in vivo activation. Related to Fig. 2 and Fig. 3. (A) Experimental scheme for evaluating TCR activation-induced proliferation of Hdac3-KO and Hdac3-WT CD8 T cells. OT-I T cells from Hdac3-KO mice or Hdac3-WT littermates were labeled with CFSE and adoptively transferred into CD45.1 congenic WT hosts. Mice were immunized subcutaneously with OVA + poly(I:C) in PBS, and transferred OT-I T cells were analyzed in LNs draining the immunization site 48 or 96 h after immunization. (B and C) Analysis of proliferation of Hdac3-KO and Hdac3-WT OT-I T cells after 48 h (B) or 96 h (C) following adoptive transfer and OVA immunization as in A. Data are representative of two independent experiments with five mice per genotype of transferred OT-I T cells. (D) Experimental scheme for evaluating homeostatic proliferation of Hdac3-KO and Hdac3-WT CD8 T cells. OT-I T cells from Hdac3-KO mice or Hdac3-WT littermates were labeled with CFSE and adoptively transferred into lymphopenic Rag1−/− hosts to assess cytokine-mediated homeostatic proliferation. (E) Representative flow cytometry plots and quantification of CFSE dilution in transferred OT-I T cells 48 h after transfer. Gated on live TCRβ+ CD8α+ Kb-SIINFEKL-tetramer+ cells. Data are representative of two independent experiments with five recipient mice per genotype of transferred OT-I T cells. (F) Representative flow cytometry plots and quantification of OT-I T cell numbers in spleens of Rag1−/− recipient mice after 5 d. OT-I T cells were defined as live TCRβ+ CD8α+ Kb-SIINFEKL-tetramer+ events. Data are representative of two independent experiments with five recipient mice for each genotype of OT-I CD8 T cells transferred. (G) Experimental scheme for evaluating the contributions of apoptosis or LN egress to reduced accumulation of Hdac3-KO CD8 T cells in LNs following activation. CD45.1+ TCR-polyclonal mice were adoptively transferred with 106 cells of a 1:1 mix of congenically distinct Hdac3-KO and Hdac3-WT OT-I T cells and immunized with OVA + poly(I:C) in PBS. Recipient mice received S1PR agonist FTY720 and/or pan-caspase inhibitor Ac-DEVD-CHO intraperitoneally at indicated time points after immunization. (n = 5, FTY720-treated groups; n = 6, FTY720-untreated groups). (H) Flow-cytometric quantification of changes in relative KO vs. WT frequencies normalized to pretransfer ratios (left), and absolute numbers of transferred Hdac3-KO and Hdac3-WT OT-I T cells in inguinal LNs of host mice 3 d after immunization (right). Data from cotransferred donor cells of each genotype within the same recipient mouse were analyzed as pairs. Data are representative of two independent experiments with five mice per treatment group. (I and J) Flow-cytometric quantification of changes in effector phenotypic markers in transferred OT-I T cells between different treatment groups as in G. Data from cotransferred donor cells of each genotype within the same recipient mouse were analyzed as pairs. Data are representative of two independent experiments with five mice per treatment group. Means ± SD are indicated (B, C, E, F, and H). P values were calculated by two-tailed Student’s t test (B, C, E, F, and H), or two-tailed ratio-paired t test (I and J). *, P < 0.05, **, P < 0.01, ***, P < 0.001.

