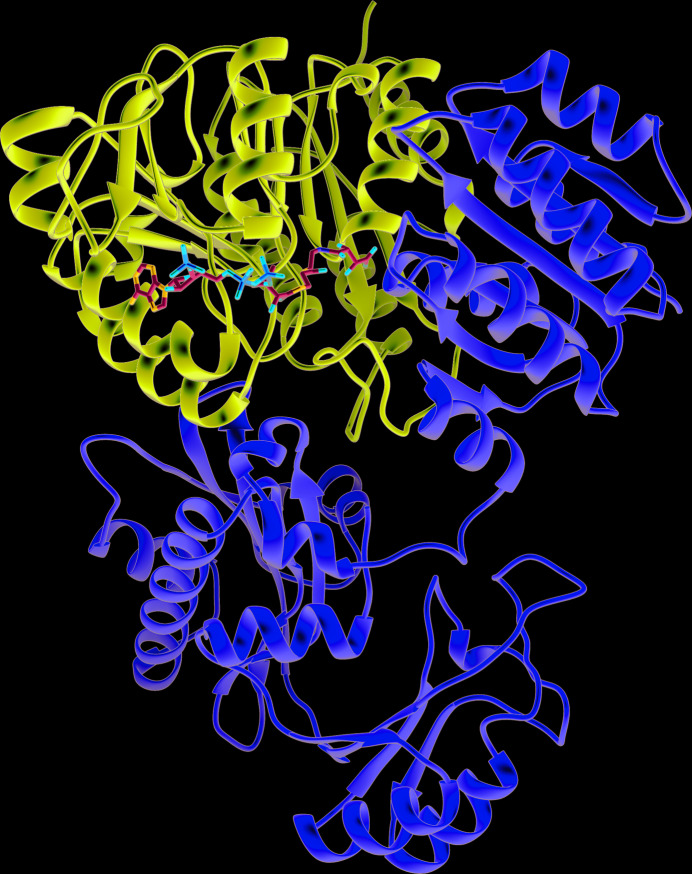
Figure 1.
Overall structure of tartryl-CoA bound to human GTPSCS. Tartryl-CoA is displayed as a stick model coloured by atom type. The α-subunit is shown in purple, while the β-subunit is shown in yellow; both are shown as ribbon diagrams. Figs. 1 ▸ and 6 ▸ were generated using UCSF Chimera (Pettersen et al., 2004 ▸).

