Figure 7.
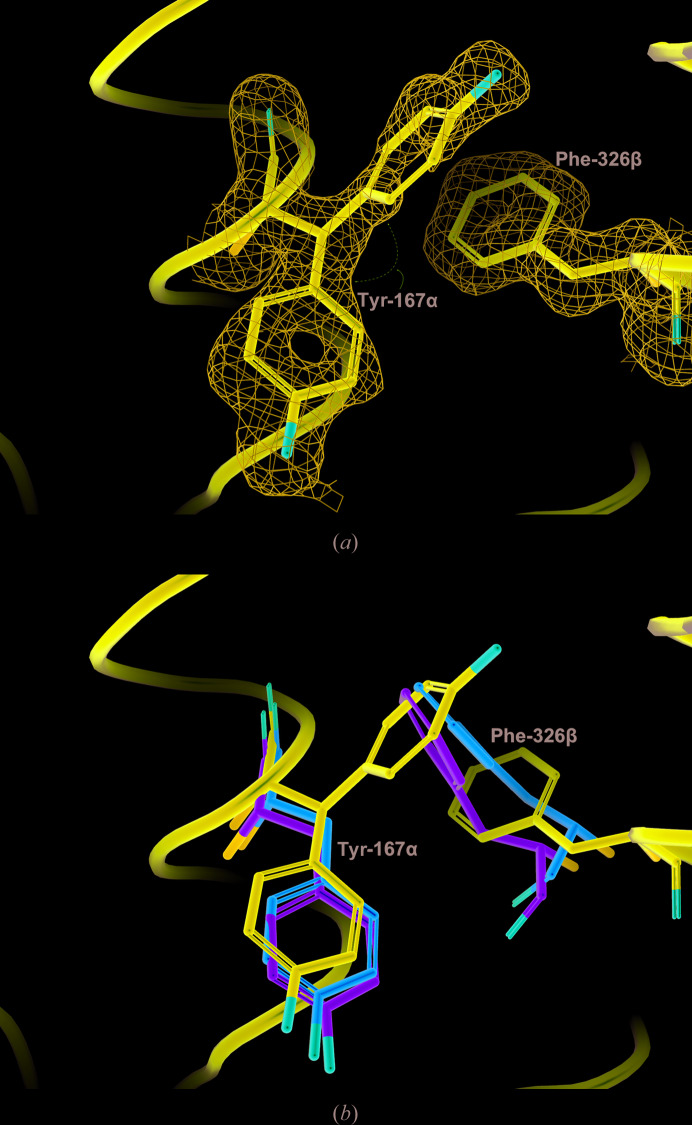
Conformations of Tyr167α and Phe326β in GTPSCS. (a) To show the reliability of the conformation of Phe326β and the alternate conformations of Tyr167α, the 2F o − F c electron-density map for tartryl-CoA-bound GTPSCS is contoured around these residues (blue net contoured at 1.0 r.m.s.d.). (b) The tartryl-CoA complex, the Mg2+-succinate complex (PDB entry 5cae; Huang & Fraser, 2016 ▸) and the dephosphorylated form of GTPSCS (PDB entry 1euc; Fraser et al., 2000 ▸) were superposed as in Fig. 6 ▸. Only portions of the ribbon diagram of the tartryl-CoA complex are drawn in purple. The side chains of Tyr167α and Phe326β are shown as stick models with C atoms coloured purple, green and orange for the tartryl-CoA complex, the Mg2+-succinate complex and the dephosphorylated form of GTPSCS, respectively.

