
Figure 1. Cardiac specific Lmna shRNA induces DCM in mice.
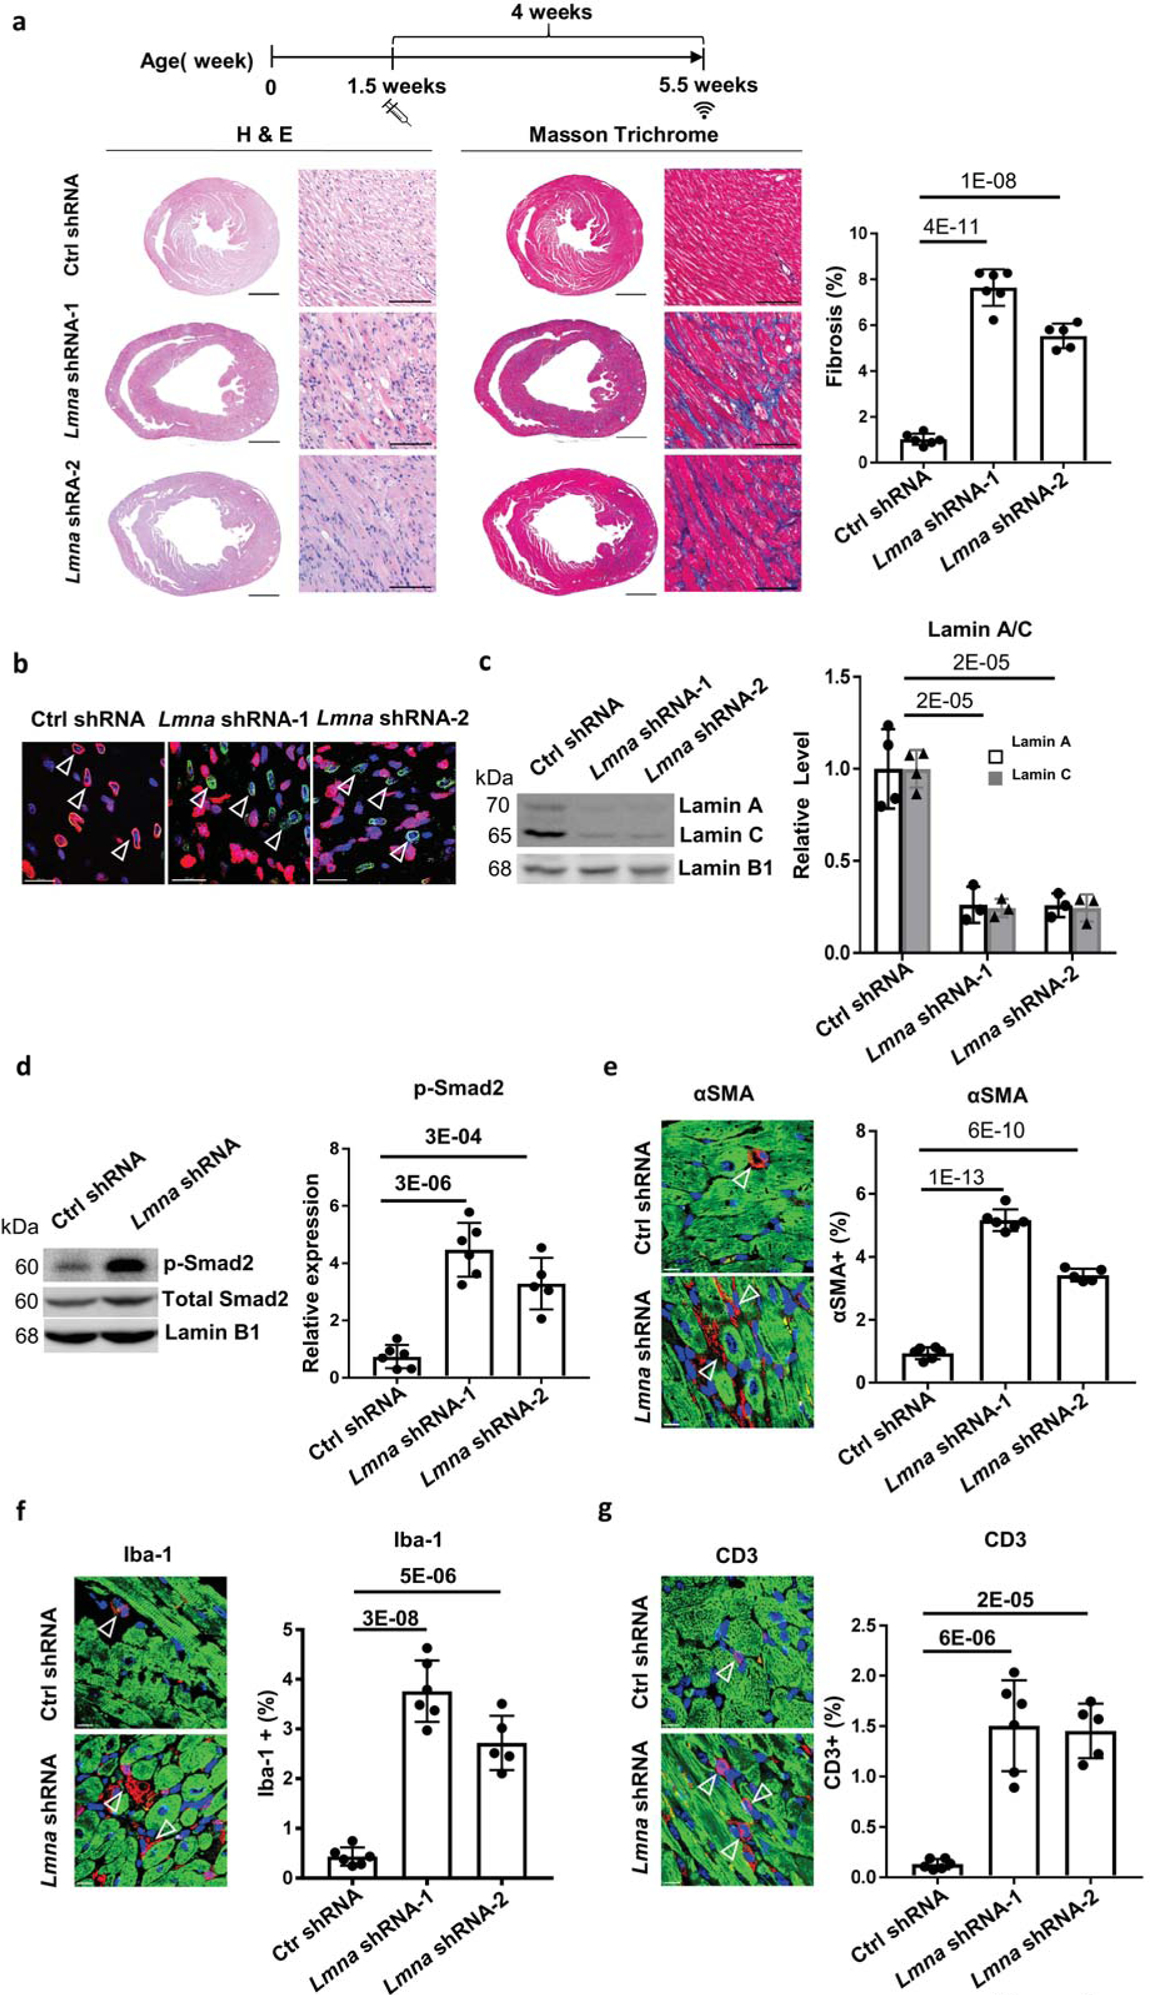
(a) Experimental timeline showing timepoints of virus injection and echocardiogram. Cardiac performance was assessed by echocardiogram at 5.5 week old. H&E and Masson Trichrome (MT) staining was performed on paraffin heart sections taken 4 weeks after control shRNA and Lmna shRNA transduction. Quantification of myocardial fibrosis of MT sections is shown, virus dose, 2.0E+13 vg/kg, n ≥ 5. Scale bars: 1000 μm for complete heart images; 100 μm for enlarged images. (b) Paraffin heart section immunostained for Lamin A/C (red), PCM1 (green) and DAPI (blue) in mice transduced with control shRNA and Lmna shRNA, scale bar = 100 μm. (c, d) Western blot and quantitative analysis of Lamin A/C protein levels in isolated cardiomyocytes (c) and phospho-Smad2 protein levels in mouse heart tissues (d), n ≥ 3. Data were normalized to Lamin B1. (e-g) Paraffin heart sections (left) and quantifications (right) of (e) αSMA (red), (f) Iba-1 (red) and (g) CD3 (red), cTnI (green) and DAPI (blue) positive cells in mice transduced with control shRNA (top) and Lmna shRNA (bottom), n ≥ 5, scale bar = 50 μm.