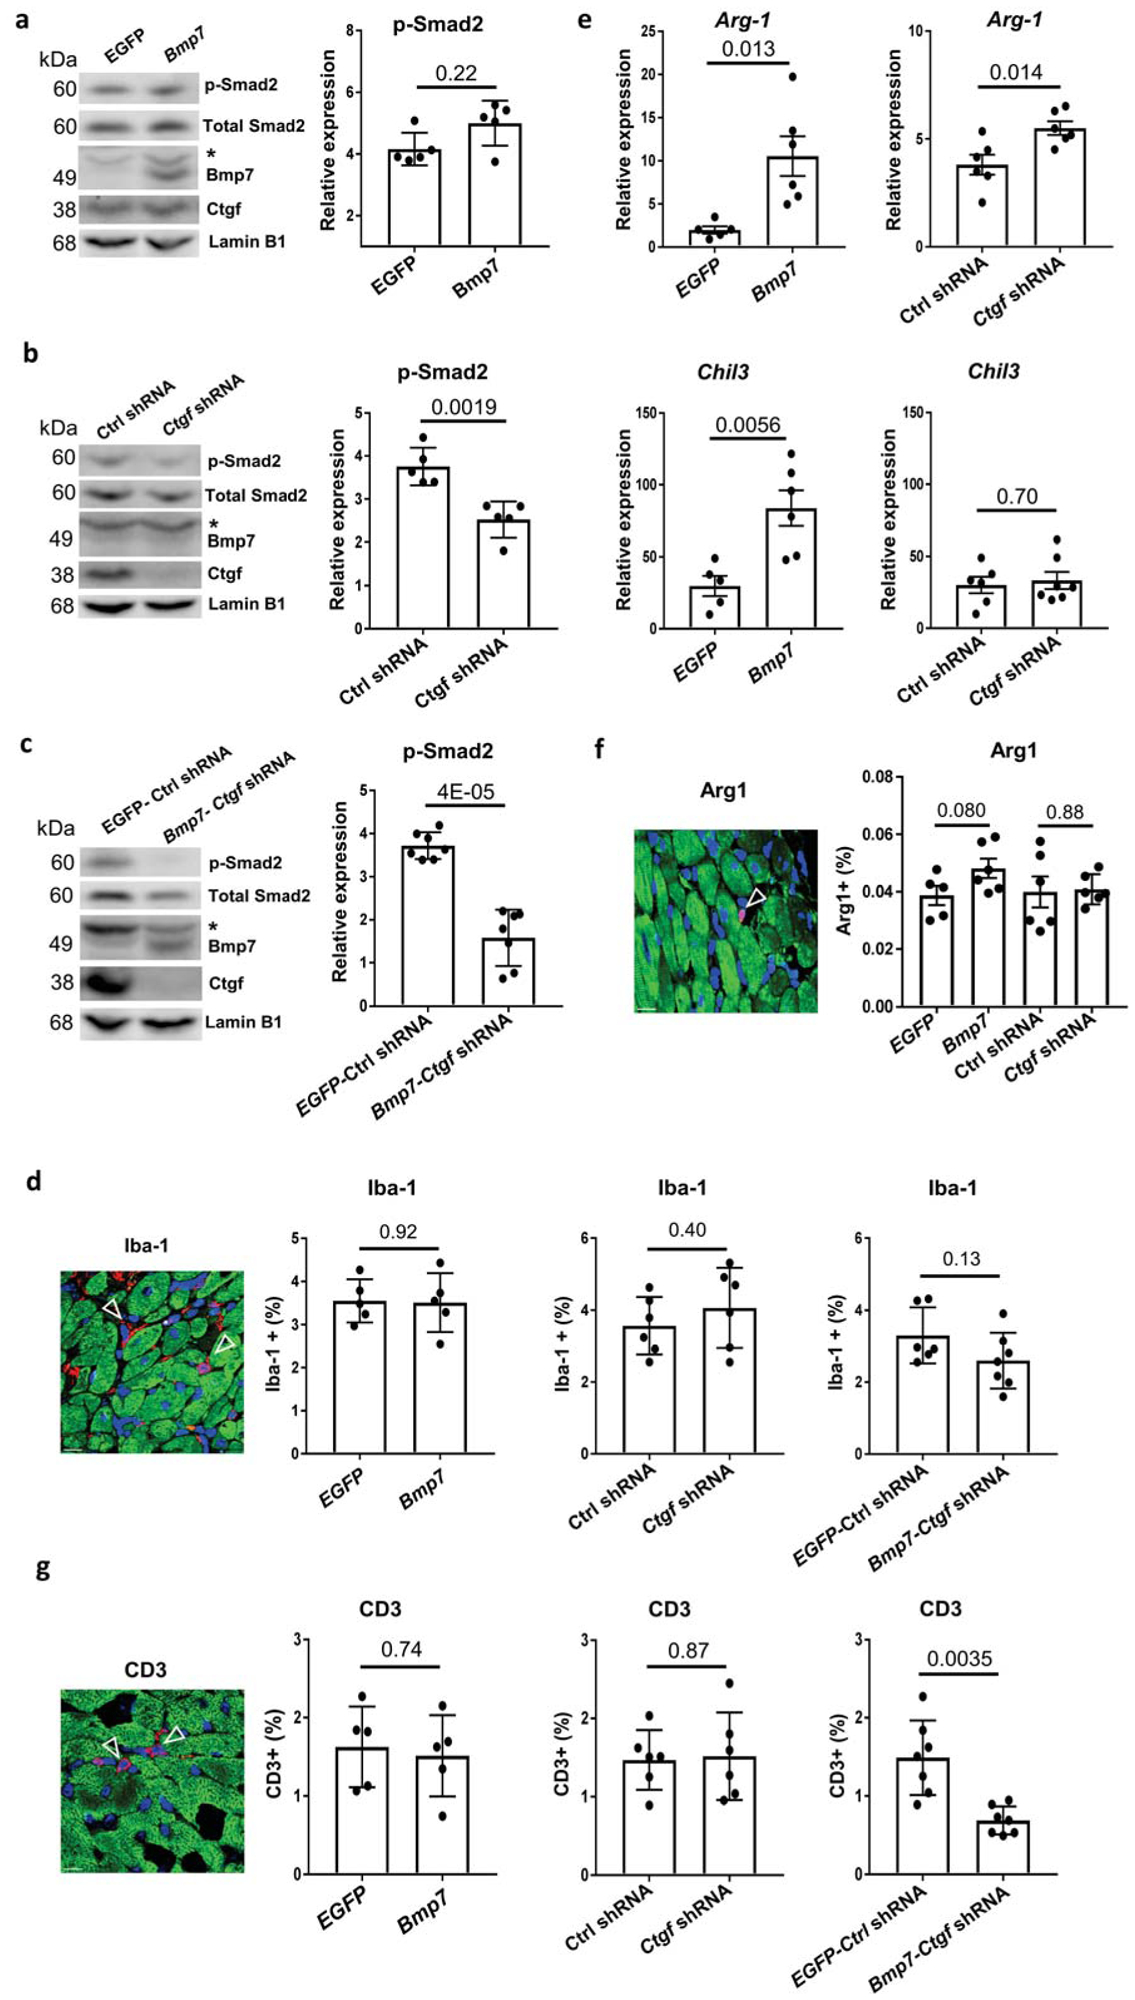
Figure 4. Bmp7 and Ctgf regulate cardiac inflammation and TGFβ signaling.

(a-c) Western blot (left panel) and quantitative analysis (right panel) of phospho-Smad2 (p-Smad2) protein levels in mouse heart tissue of Lmna DCM groups treated with (a) EGFP or Bmp7; (b) Ctrl shRNA or Ctgf shRNA or (c) EGFP Ctrl shRNA or Bmp7-Ctgf shRNA, n ≥ 5. Data were normalized to Lamin B1.* indicates the non-specific band. (d, f and g) Paraffin heart section staining (left panel) and quantifications (right pane) of (d) Iba-1 (red), (f) Arginase 1 (red) and (g) CD3 (red), cTnI (green) and DAPI (blue) positive cells in Lmna DCM groups treated with EGFP, Bmp7, Ctrl shRNA, Ctgf shRNA, EGFP-Ctrl shRNA or Bmp7-Ctgf shRNA, scale bar = 50 μm, n ≥5. (e) Quantitative real-time PCR analyses of Arg-1 and Chl3 expression in Lmna DCM groups treated with EGFP, Bmp7, Ctrl shRNA, Ctgf shRNA, n ≥ 5.
