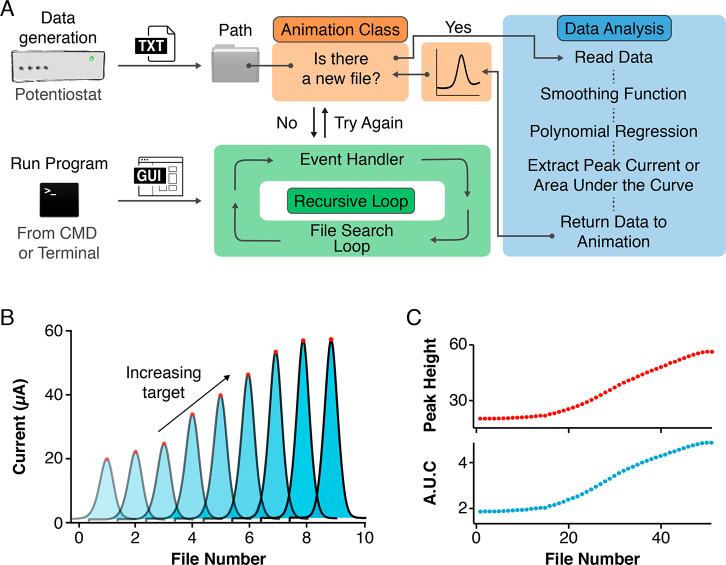
Figure 1.
Software framework for the real-time analysis of high-volume electrochemical data. We have developed an open-source, easily customizable script written in the Python programming language to enable the real-time analysis of electrochemical measurements collected with multiple platforms. (A) Our script uses a recursive loop to continuously handle user-interface events while simultaneously looking in a user-defined Path folder for new files generated by, for example, a potentiostat. Once a data file exists, the script activates a Data Analysis module which performs a series of data processing steps including signal averaging and least-squares fitting to a user-defined function and returns the processed data to an Animation Class to be visualized. The terms “CMD” and “Terminal” refer to programs installed by default in Microsoft Windows and Apple macOS, respectively, which provide text-based access to control the operating systems. (B) In this work, we used square-wave voltammograms arising from electrochemical sensors to illustrate the capability of our code to extract peak currents (calculated as the difference between peak maximum and its two minima) and Areas Under the Curve (AUCs). (C) The script outputs and visualizes these values in real-time as the experiment progresses. See Figures S1 and S2 for snapshots of the software’s graphical user interface.

