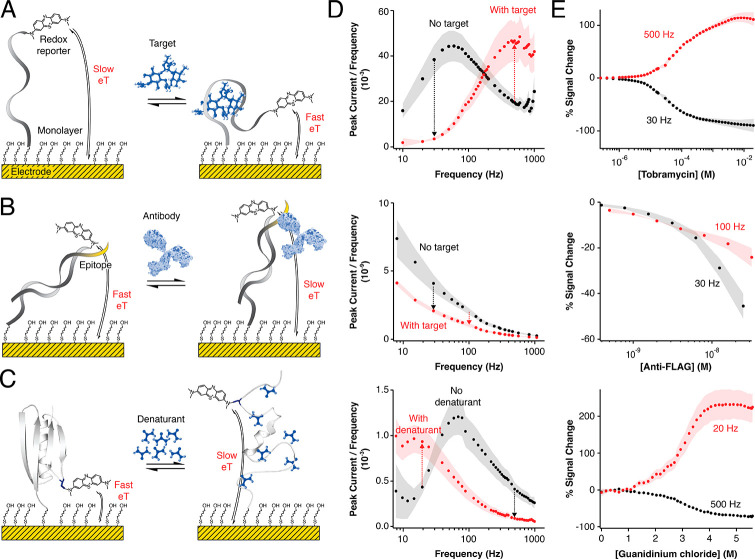
Figure 2.
Our software enables the multielectrode, multifrequency processing of square-wave voltammograms. Here we illustrate this via the analysis of three systems commonly used in our laboratories: (A) a small molecule drug-detecting E-AB sensor,5,12 (B) an antibody-detecting DNA-scaffold sensor,14,39,40 and (C) a protein site-specifically attached to an electrode in support of biophysical studies of its folding thermodynamics.6,15,41 By supporting the simultaneous analysis of voltammograms recorded on multiple electrodes and at multiple frequencies, our software facilitates the characterization of (column D) the electron transfer behavior and (column E) the frequency-dependent signal gain (relative signal change42) of each system. Simultaneously it performs real-time statistical analysis of electrode-to-electrode variation in the peak current or area under the voltammogram (AUC), illustrated here as the shaded areas in columns D and E. The arrows in panel D indicate the expected signal ON or OFF response of each platform at such frequencies; the arrows also marked the frequencies used for the calibration of each platform in column E. The illustration of the antibody in panel B was modified from ref (43).

