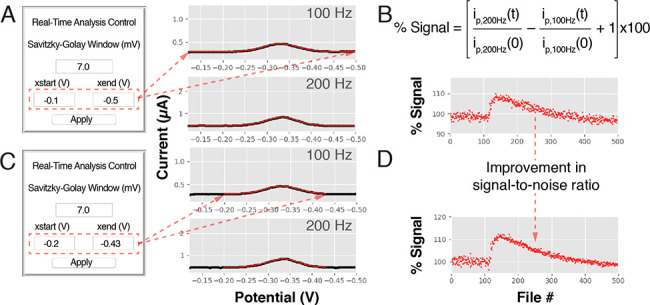
Figure 3.

Real-time control of software parameters improves the analysis of electrochemical data. We have implemented the ability to control parameters in real time in our software, a feature that can be useful for the analysis of electrochemical measurements recorded under fluctuating conditions or for repetitive measurements performed over long experimental times in harsh conditions. (A) Here, for example, we show square-wave voltammograms recorded with a tobramycin-detecting E-AB sensor emplaced in the jugular vein of a live rat. Using our software we extracted peak currents from the voltammograms by performing (1) a five point rolling average to remove high frequency noise, (2) a polynomial regression of the data, and (3) calculating the difference between the peak current and the lowest of the two current minima (the “valleys” in the voltammograms) from the best-fit curve obtained from the regression. (B) We serially interrogated the sensor every 10 s over 80 min at square-wave frequencies of 100 and 200 Hz. The visualization module produced graphs of the relative signal change. (C) By adjusting the data range analyzed from each voltammogram considered in our analysis (red line limited by the red arrows in panel C), we corrected for poor voltammogram baselines and (D) improved the signal-to-noise ratio of our measurements 2-fold.
