
Extended Data Fig. 6. TRIP13 alterations, expression levels and effect on Olaparib resistance in cancers, cancer cell lines and a BRCA1-deficient model.
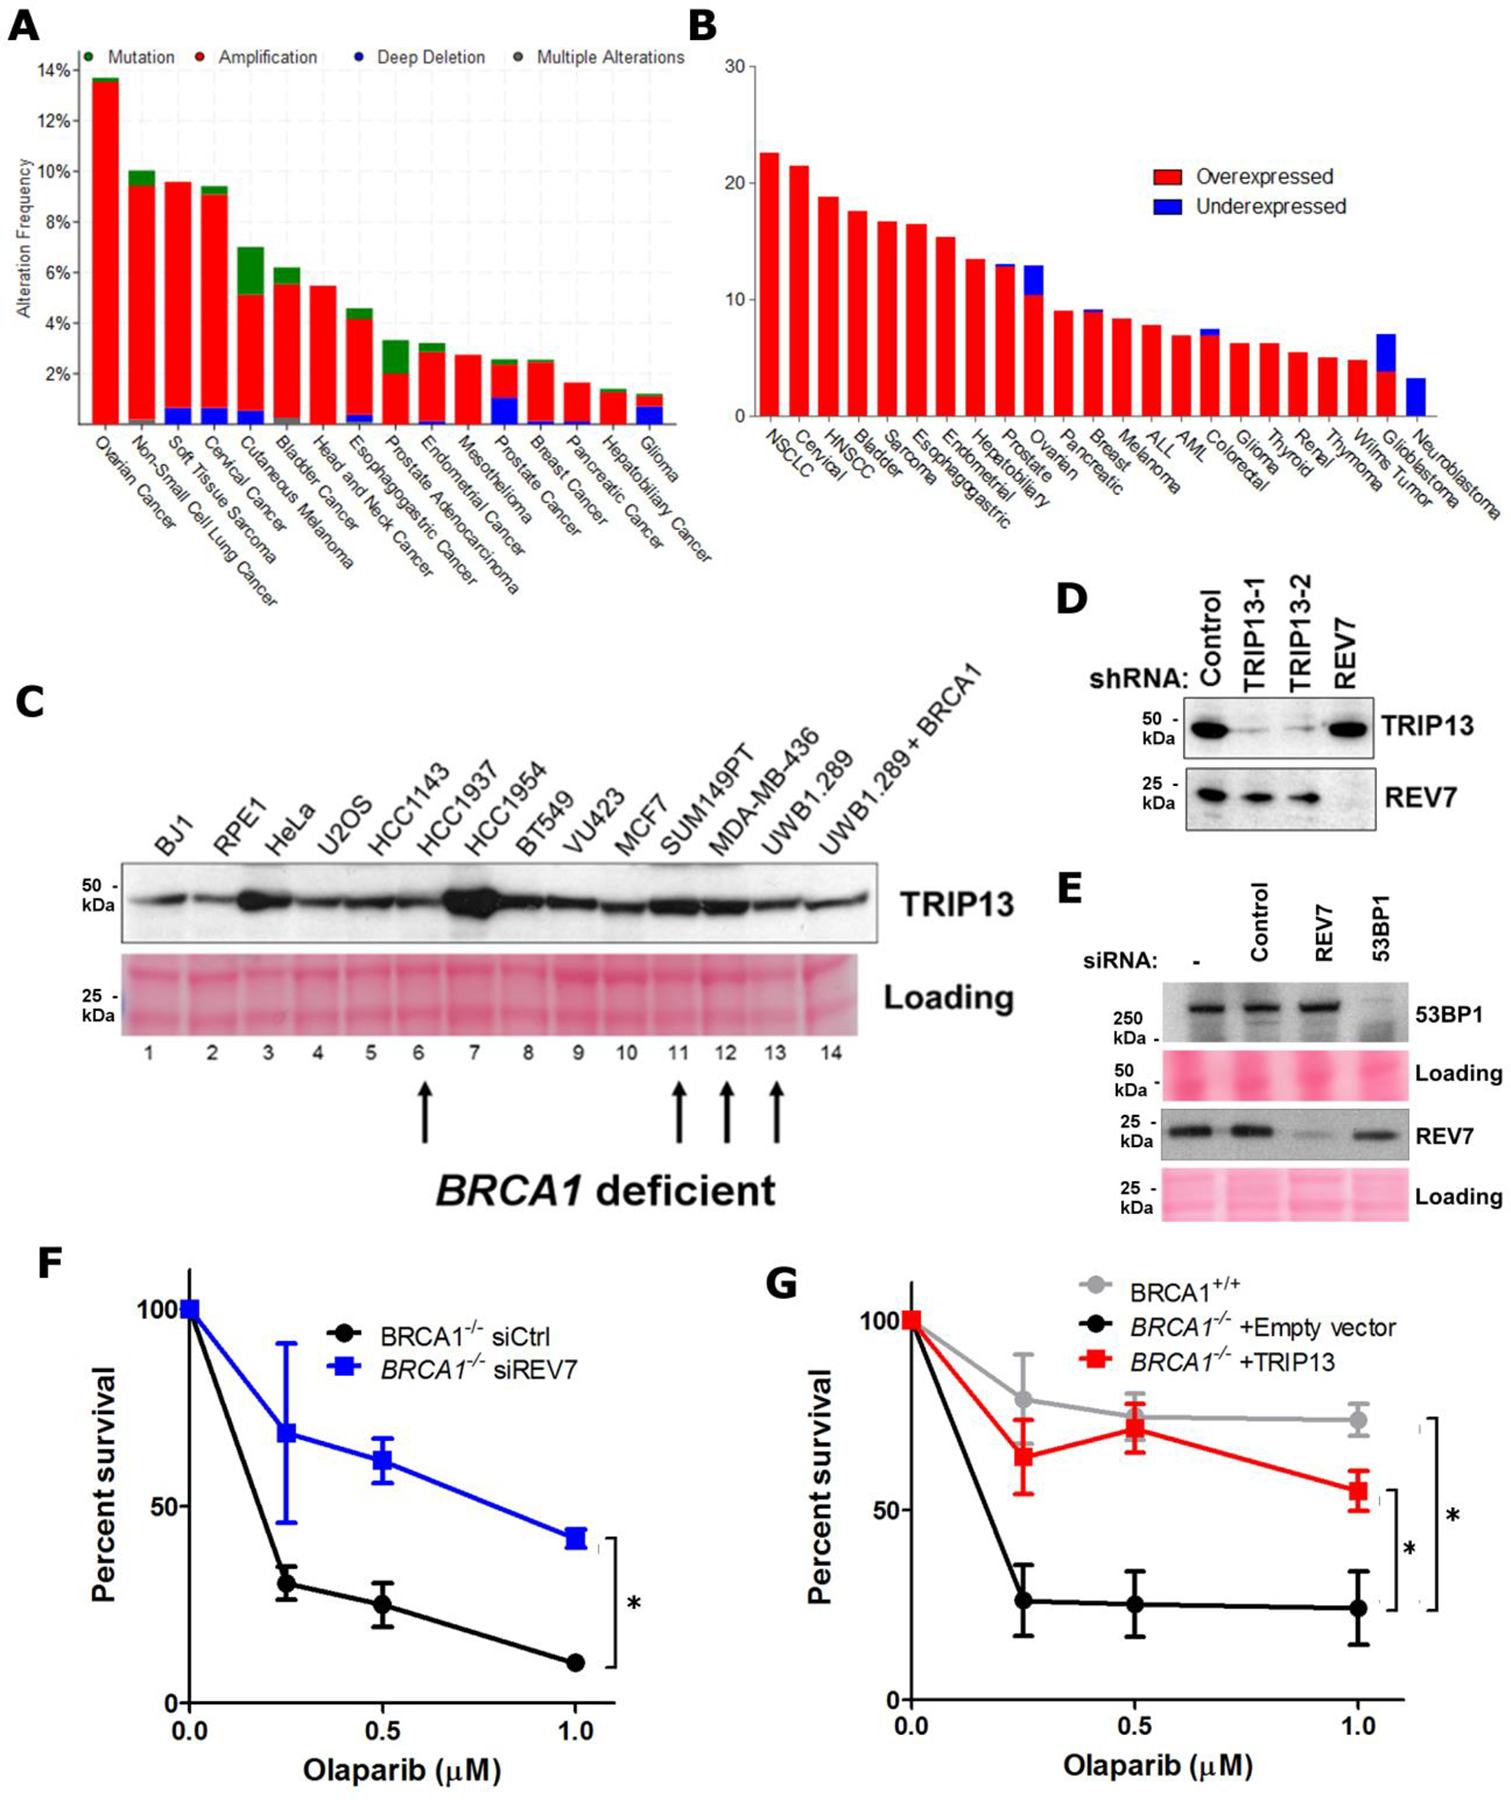
a. Summary of TRIP13 genomic alterations across various cancer types in TCGA. b. Summary of TRIP13 transcriptional alterations across various cancer types in TCGA. c. Western blot showing TRIP13 protein levels from a panel of breast and ovarian cancer cell lines and Ponceau S staining as loading control. BRCA1-mutant cell lines are indicated with arrows. d. Western blot showing knockdown of TRIP13 and REV7 in the SUM149PT cells. e. Western blot showing knockdown of REV7 and 53BP1 in SUM149PT cells. f. 14-day clonogenic survival assay of RPE-1 TP53BP1−/− and TP53BP1−/− BRCA1−/− cell lines with siRNAs targeting control, TRIP13 or REV7 and treated with indicated olaparib doses. n=3 biologically independent experiments, siCtrl vs. siREV7: p = 0.005 (2-Way ANOVA). g. 14-day clonogenic survival assay of BRCA1+/+ and BRCA1−/− cells expressing Empty vector or TRIP13 treated with indicated Olaparib doses, n=3 biologically independent experiments, BRCA1+/+ vs. BRCA1−/− +Empty vector: p <0.0001, BRCA1−/− +Empty vector vs. BRCA1−/− + TRIP13: p<0.0001 (2-Way ANOVA). All immunoblots are representative of at least 2 independent experiments.