
Fig. 4. TRIP13 promotes homologous recombination.
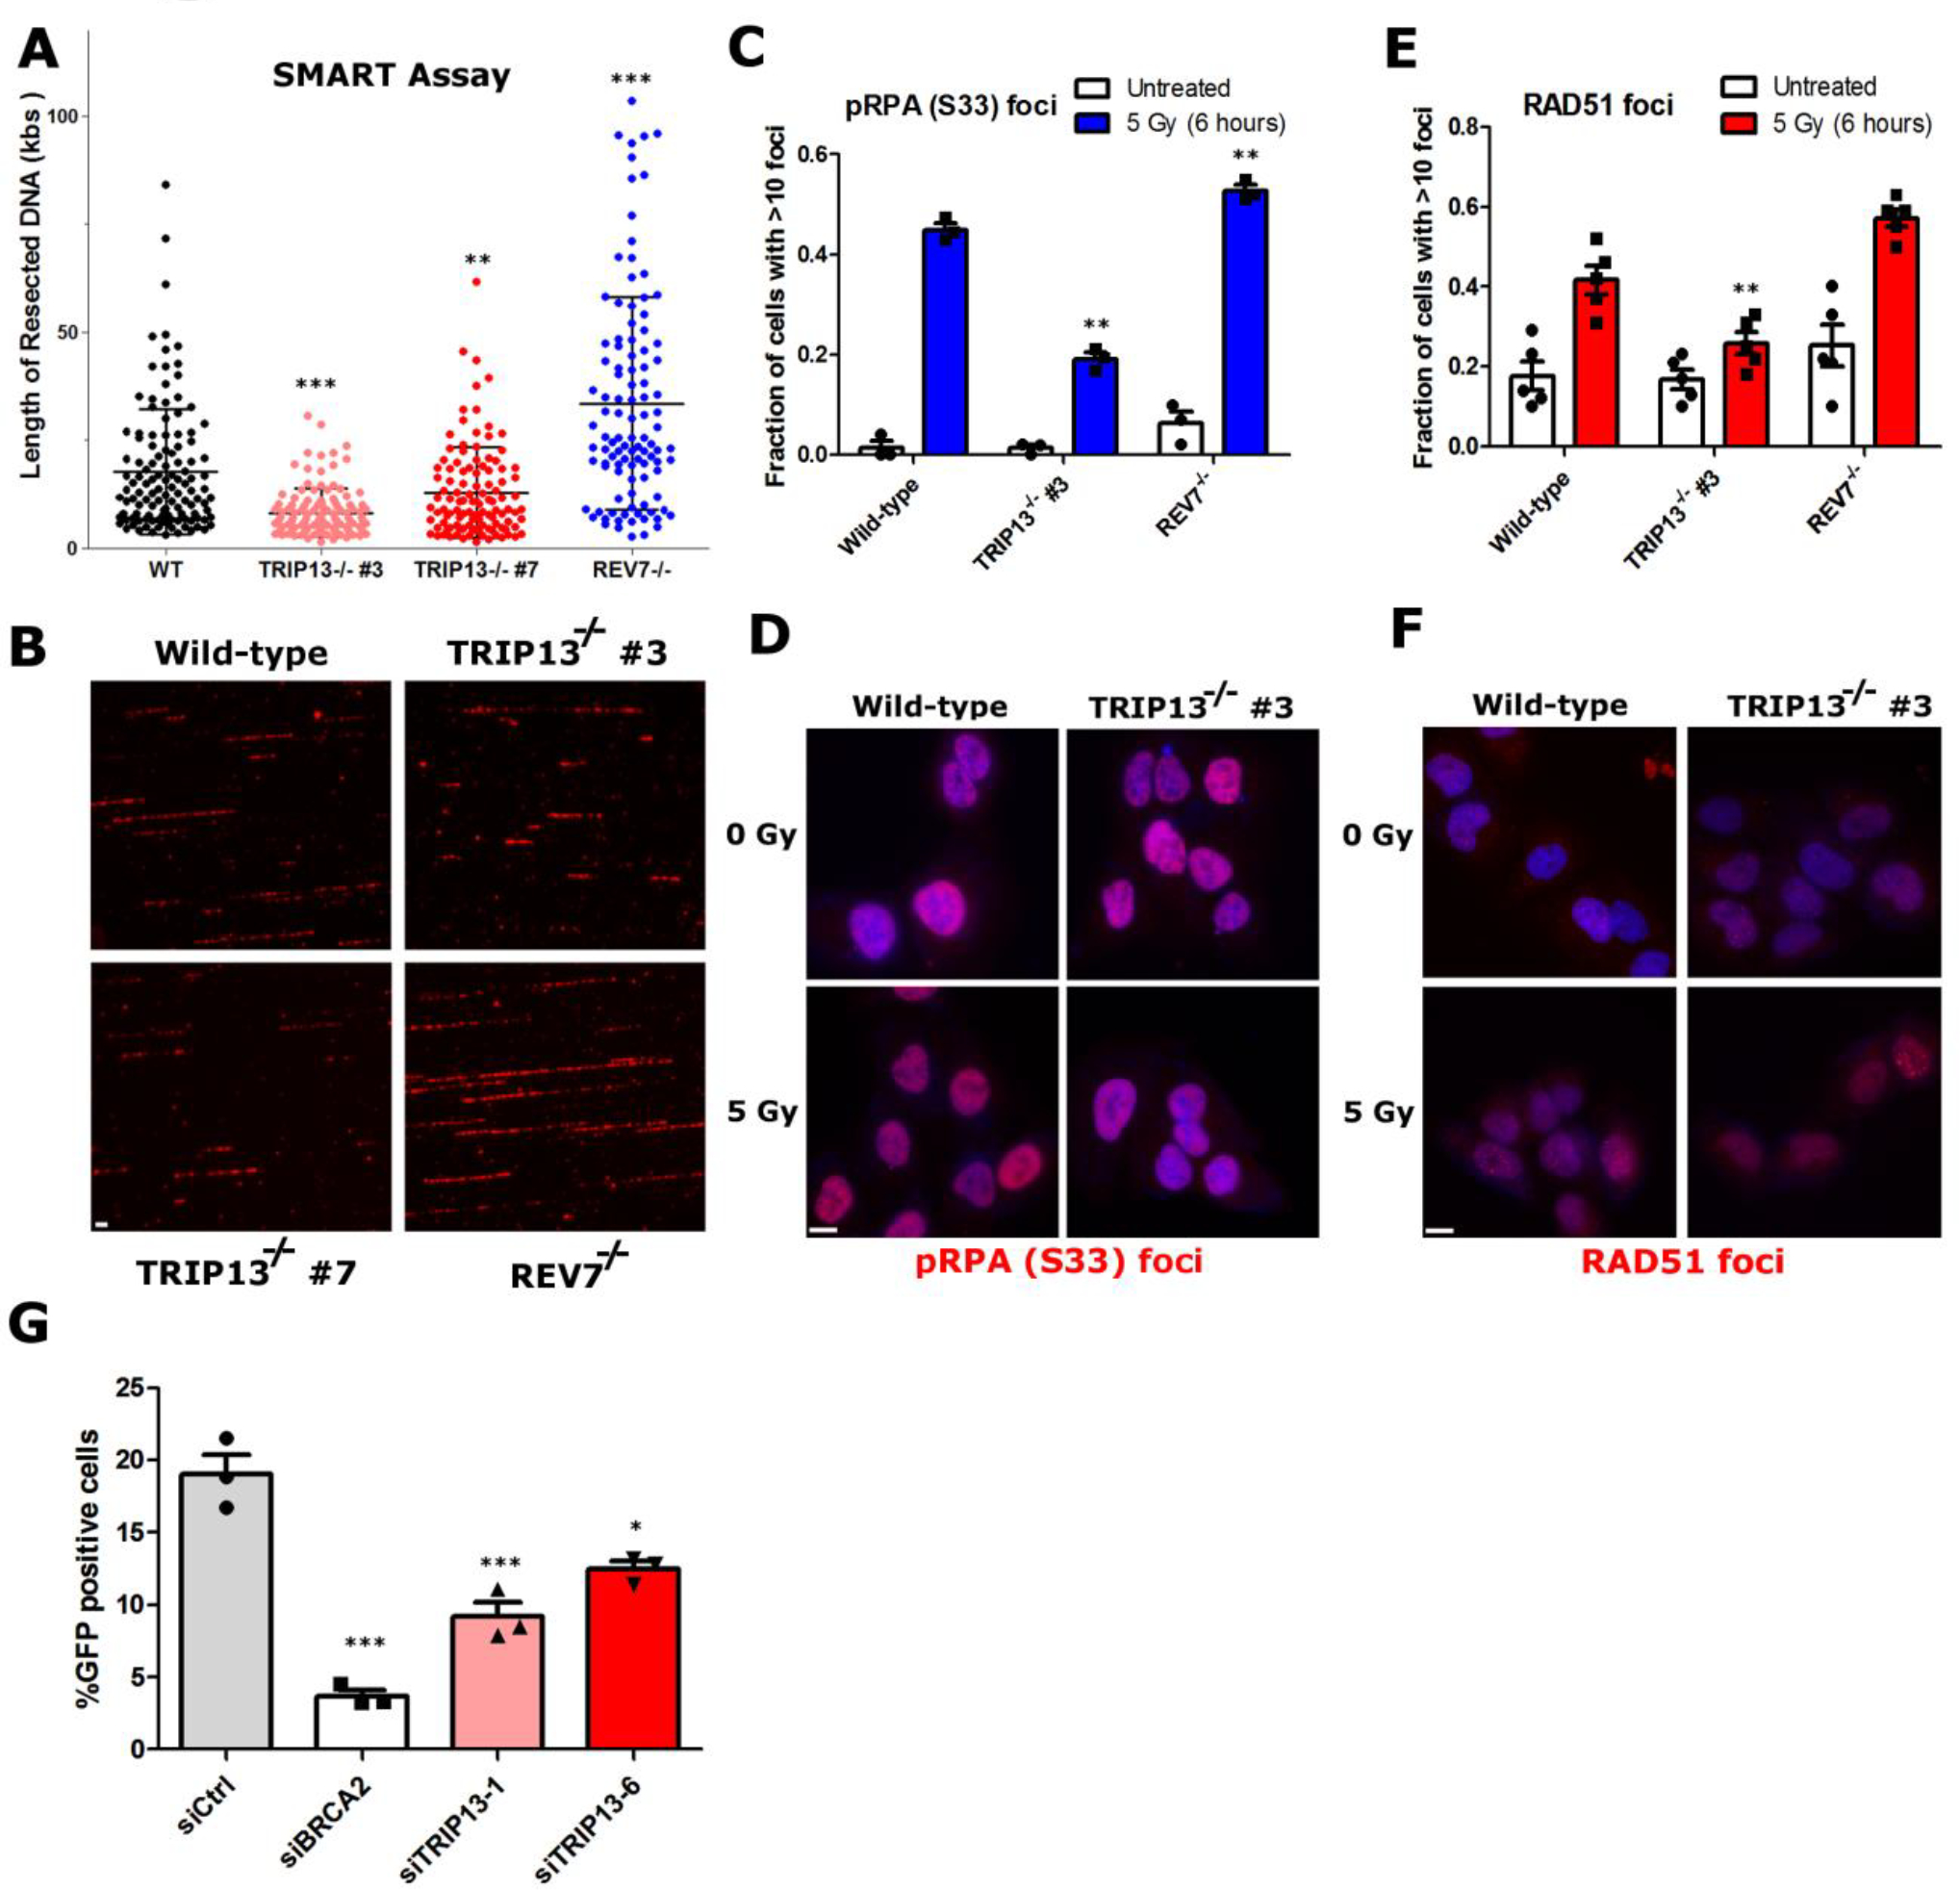
a. Quantification of resected ssDNA in U2OS wild-type, TRIP13−/− (two clones) and REV7−/− cells measured by SMART assay, ~100 fibers were counted per experiment, Wild Type vs. TRIP13−/− #3: p < 0.0001, Wild Type vs. TRIP13−/− #7: p = 0.004, Wild Type vs. REV7−/−: p < 0.0001 (Mann-Whitney test, two-tailed), bars indicate mean and SEM. b. Representative images for (a), with BrdU in exposed ssDNA tracts labeled red. (Scale bar: 1 μm) c. Proportion of U2OS cells with greater than 10 p-RPA32(S33) foci 6 hours following IR treatment. n=3 biologically independent experiments, Wild Type vs. TRIP13−/− #3: p = 0.001, Wild Type vs. REV7−/−: p = 0.01 (Student’s t-test, two-tailed). d. Representative images of data in (c) (Scale bar: 10 μm). e. Proportion of U2OS cells with greater than 10 RAD51 foci 6 hours following IR treatment. n=6 biologically independent experiments, Wild Type vs. TRIP13−/− #3: p = 0.01, Wild Type vs. REV7−/−: p = 0.02 (Student’s t-test, two-tailed). f. Representative images of data in (e) (Scale bar: 10 μm). g. Percentage of GFP-positive cells following infection of U2OS DR-GFP cells with I-SceI adenovirus with knockdown of BRCA2 or TRIP13. n=3 biologically independent experiments, siCtrl vs siBRCA2: p = 0.0004, siCtrl vs. siTRIP13–1: p = 0.004, siCtrl vs. TRIP13–6: p = 0.01 (Student’s t-test, two-tailed), all error bars indicate SEM. Statistical source data are provided in Source Data Fig. 4.