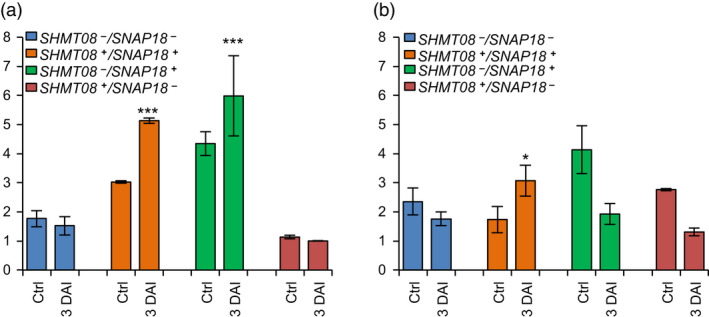
Figure 4.

Expression analysis of GmSNAP18 and GmSHMT08 in Forrest, Essex and ExF RIL lines. Quantitative RT‐PCR analysis of (a) GmSNAP18 and (b) GmSHMT08 in F5 ExF RIL lines from infected and non‐infected root tissue with SCN HG‐type 0. F5‐derived RILs from the ExF population were haplotyped for the two genes, GmSNAP18 and GmSHMT08, and then classified into four different genotypes (GmSNAP18 +/−; GmSHMT08 +/−) according to their allelic combinations. Expressions were normalized using ubiquitin as reference as shown; the mean ± standard deviation (SD) is shown. DAI, days after infection; Ctrl, control plant. The experiment was repeated three times, and similar results were obtained. Five plants per line were used for each experiment. Asterisks indicate significant differences between the tested RILs in the presence and absence (Ctr) of SCN infection as determined by ANOVA (*** P < 0.0001, ** P < 0.01, * P < 0.05).
