Figure 1.

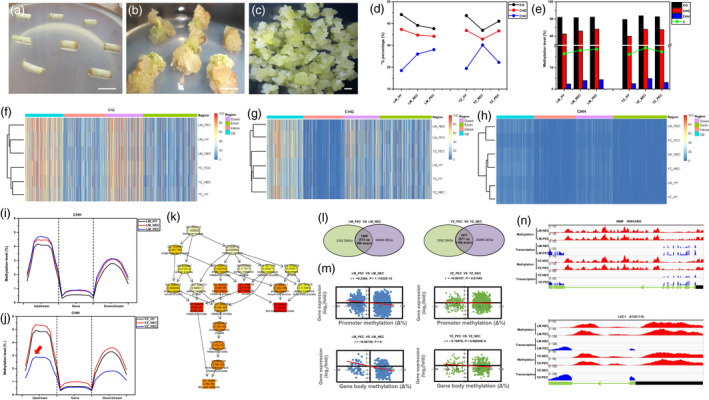
Genome‐wide single‐base resolution dynamic DNA methylome reveals CHH hypomethylation marked and distinguished the embryogenic redifferentiation. (a–c) Morphology of critical developmental stages during cotton SE. (a) Hypocotyls (HY). (b) Dedifferentiated nonembryogenic calli (NEC). (c) Redifferentiated primary embryogenic calli (PEC). Bar = 1 mm. (d–e) Overall methylcytosines (mCG, mCHG and mCHH) during SE transdifferentiation in LM and YZ. (d) Percentage of methylcytosines. (e) Methylation levels of methylcytosines. (f–h) Clustering of methylation levels of mCG, mCHG and mCHH on different transcriptional elements during SE transdifferentiation in LM and YZ. (i) mCHH methylation levels on different transcriptional elements in LM. (j) mCHH methylation levels on different transcriptional elements in YZ. (k) Enrichment of differentially methylated genes during embryogenic redifferentiation in YZ (PEC VS NEC). (l–n) Association analysis of DNA methylome and transcriptome during embryogenic redifferentiation in LM and YZ. (l) Codifferential genes with significant variations in both DNA methylation and transcription in two genotypes respectively, combining hyper‐ and hypomethylated genes at three sequence contexts. (m) Correlation analysis of variations in DNA methylation and transcription on gene‐body and promoter regions. (n) Representative genes showing negative correlations between DNA methylation and transcription. BBM, Baby boom; LEC1, Leafy cotyledon 1. Tracks of BS‐seq and RNA‐seq reads were shown for each gene, including the transcribed regions and the upstream regions. Gene structures are shown at the bottom, with light green boxes representing exons, light green lines representing introns, black boxes representing upstream 2 kb regions and arrows indicating transcription direction.
