
Figure 3.
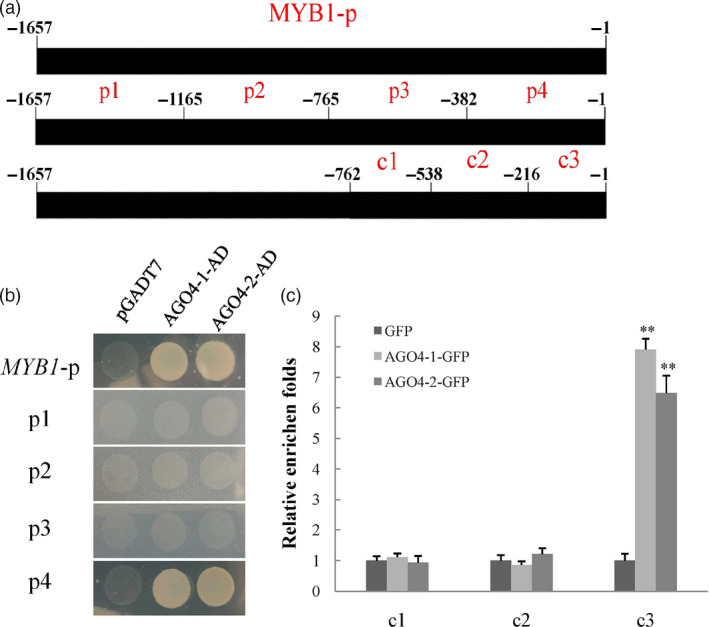
Interaction between MdAGO4‐1/2 and promoter of MdMYB1. (a) Regions of MdMYB1 promoter used in interaction analyses. Black rectangles represent MdMYB1 promoter (−1,657 to −1 bp). Four different regions (p1–4) in the MdMYB1 promoter were used for the Y1H assays; three regions (c1–3) were designed for ChIP‐qPCR assay. (b) Y1H assays showing interactions between MdAGO4‐1/2 with the MdMYB1 promoter and the p4 region. Empty AD vector was used as the negative control. (c) ChIP‐PCR results showing binding of MdAGO4‐1/2 to c3 region of MdMYB1 promoter in vivo. Apple ‘Orin’ callus overexpressing GFP protein was used as the control. Error bars show standard derivation of three replicates, ‘**’ indicates significance at P < 0.01.