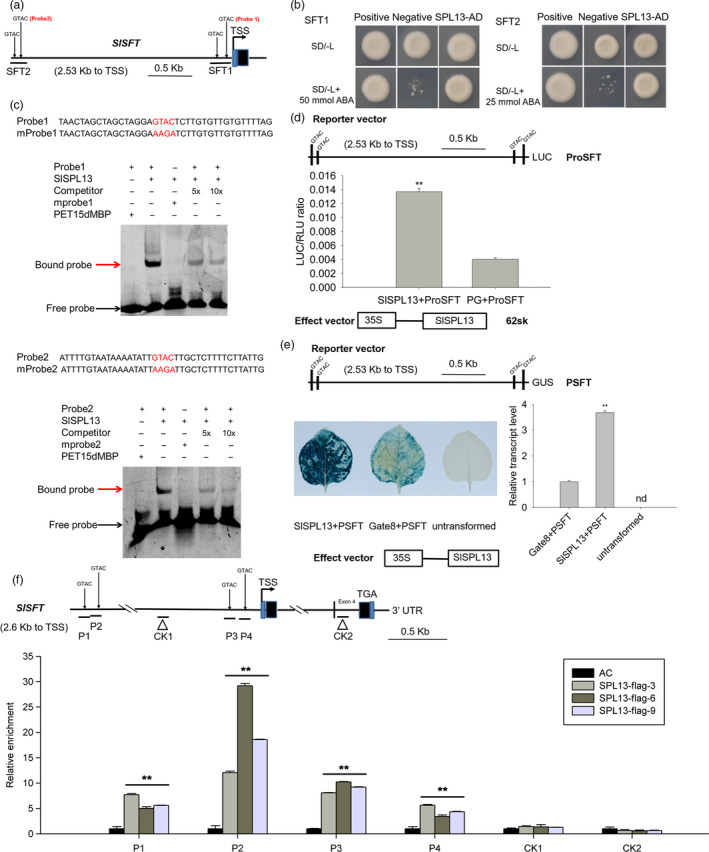
Figure 6.

SPL13 binds to the SFT promoter and activates SFT expression. (a) Schematic diagram of the 2533 bp SFT promoter region. Four GTAC‐containing cis‐elements were identified in the promoter of SFT. Two constructs containing two different promoter fragments (SFT1 and SFT2) were used in the yeast one‐hybrid (Y1H) assay. SFT2 and SFT1 contain from −2528 to −2246 bp and from −289 to 0 relative to the translational start codon, respectively. (b) Y1H analysis of SPL13 binding to the different core sequences from the SFT promoter. The bait vectors, SFT1 and SFT2, and the SPL13‐containing prey vector were introduced into the yeast strain Y1H gold. The enhanced resistance to ABA indicates an interaction between the bait and prey. Co‐transformation of the bait vectors, SFT1 and SFT2, with either pGADT7 or pGADT‐Rec2‐53 served as negative and positive controls, respectively. (c) EMSA assay testing the binding of SPL13 to SFT promoter fragments. Two 39‐bp single‐strand oligonucleotide probes containing GTAC sequences were synthesized and labelled with biotin. Unlabelled fragments were used as negative controls. The His‐6‐MBP‐SPL13 protein was incubated with the biotin‐labelled probe containing GTAC or the mutated probe (mprobe) containing the AAGA sequence. The unlabelled fragment was used as a competitor. + and ‐ indicate the presence and absence of the corresponding probe or protein. The arrows indicate the protein–DNA complex (red arrow) or free probe (black arrow). (d) Dual luciferase system analysis of SPL13 binding the promoter of SFT. The SFT promoter fragment was inserted into the reporter vector (pGreen II 0800 LUC). SPL13 was inserted into the effector vector (pGreen II 62‐SK). The resulting constructs were transiently expressed in tobacco (Nicotiana benthamiana) leaves by Agrobacterium tumefaciens‐mediated transformation. LUC, firefly luciferase activity; RLU, Renilla luciferase activity; PG, the empty vector of pGreen II 62‐SK. The SFT promoter plus PG was used as a control. Values are presented as means ± SE (n = 3). The asterisks indicate statistically significant differences that were determined using the t‐test: *, P < 0.05, **, P < 0.01. (e) GAL4/UAS‐based analysis on SPL13 binding to the SFT promoter. The promoter of SFT was fused to an open reading frame encoding the GUS protein (PSFT‐GUS), and SPL13 was expressed in the pHELLSGATE8 vector (35S‐SPL13). The resulting constructs were transiently co‐expressed in the leaves of N. benthamiana. PSFT‐GUS and the empty vector pHELLSGATE8 were included as controls. Values are presented as means ± SE (n = 3). The asterisks indicate statistically significant differences that were determined using the t‐test. *, P < 0.05, **, P < 0.01. nd, Not detected. (f) ChIP qPCR analysis of SPL13 binding to the SFT promoter in the WT and 35S‐SPL13‐flag transgenic tomato plants. The P1, P2, P3 and P4 fragments contain GTAC cis‐elements. CK1 and CK2 are located in the promoter and coding sequence of SFT, respectively. The relative enrichment of the six promoter fragments in the young leaves of three transgenic lines was quantified using qPCR. Data were normalized to those of the WT plants. This experiment was repeated three times. The data presented are the means ± SE. The asterisks indicate statistically significant differences relative to the WT that were determined using the t‐test: *, P < 0.05, **, P < 0.01.
