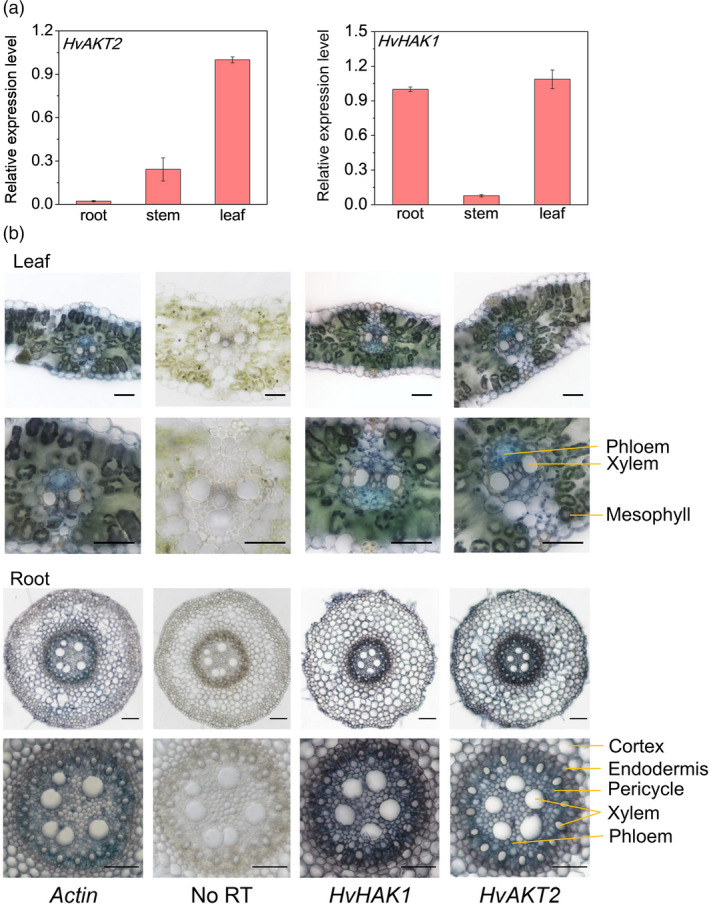
Figure 2.

Tissue and cell‐type gene expression patterns of HvAKT2 and HvHAK1 in barley. (a) qRT‐PCR analysis of the relative transcript levels of HvAKT2 and HvHAK1 in different tissues of XZ5. (b) Tissue localization of HvAKT2 and HvHAK1 by in situ PCR. All samples were stained with BM Purple. The blue colour indicates the presence of digoxigenin (DIG)‐labelled cDNA. HvActin is a positive control. No reverse transcription (RT) is included as a negative control. Representative images are shown out of five replicates. Bars = 50 μm.
