
Figure 5.
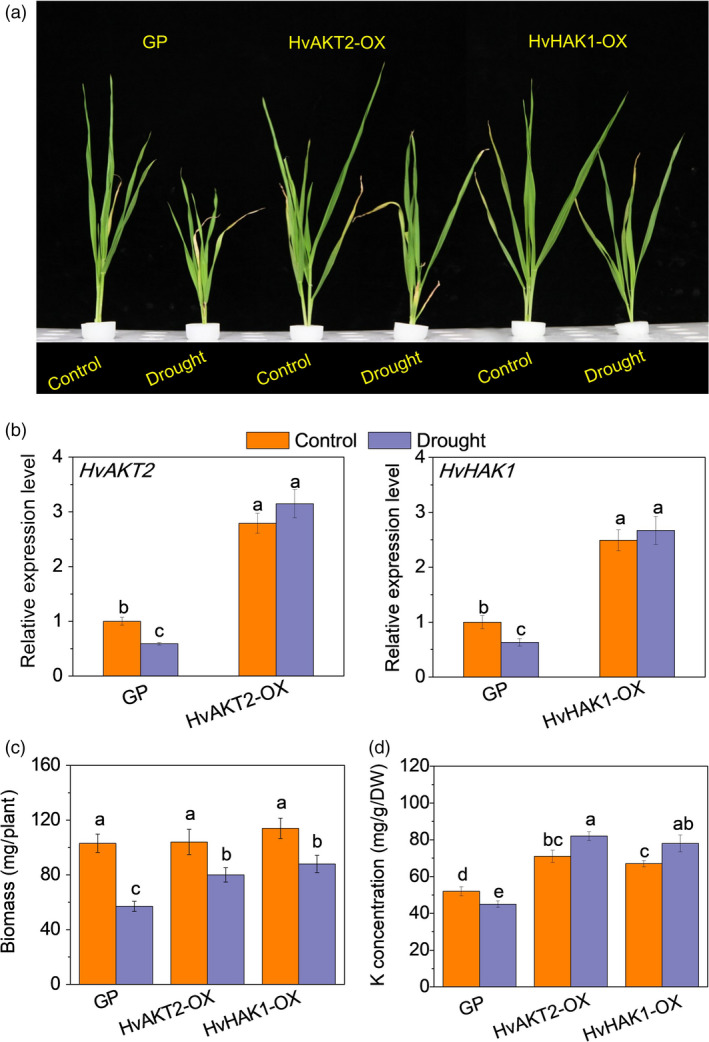
Functional assessment of HvAKT2 and HvHAK1 via gene overexpression.(a) Phenotype in Golden Promise (GP) and overexpressed lines (OX). Control and drought correspond to basic nutrition solution (BNS) and BNS + 20% PEG (drought), respectively. (b) qRT‐PCR of HvAKT2 and HvHAK1 in two transgenic overexpression lines HvAKT2‐OX2 and HvHAK1‐OX2 (see Figure S6). (c) Biomass in GP and overexpressing barley lines. (d) K concentration in leaves of GP and overexpressing barley lines. Seedlings were grown in BNS for 10 days, followed by PEG‐induced drought for 5 days. Data are mean ± SD (n = 6), and different letters indicate significant differences (P < 0.05).