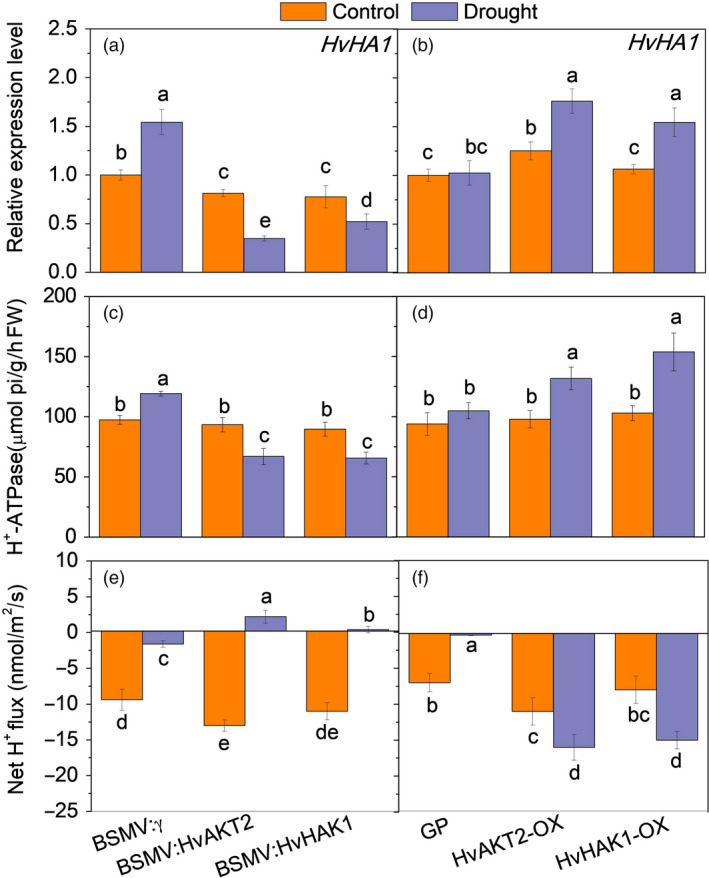
Figure 6.

Drought‐induced expression of HvHA1, H+‐ATPase enzyme activity and H+ flux in leaves of transgenic barley lines. qRT‐PCR analysis of HvHA1 (a, b), activity of H+‐ATPase (c, d) and H+ fluxes (e, f) in leaves of silenced and overexpressed plants in the control and drought. Seedlings were grown in BNS for 10 days, followed by PEG‐induced drought for 5 days. Steady‐state H+ fluxes were measured over 0h (control) and 1h (PEG‐induced drought). Data are mean ± SD (n = 6), and different letters indicate significant differences (P < 0.05).
