
Figure 1:
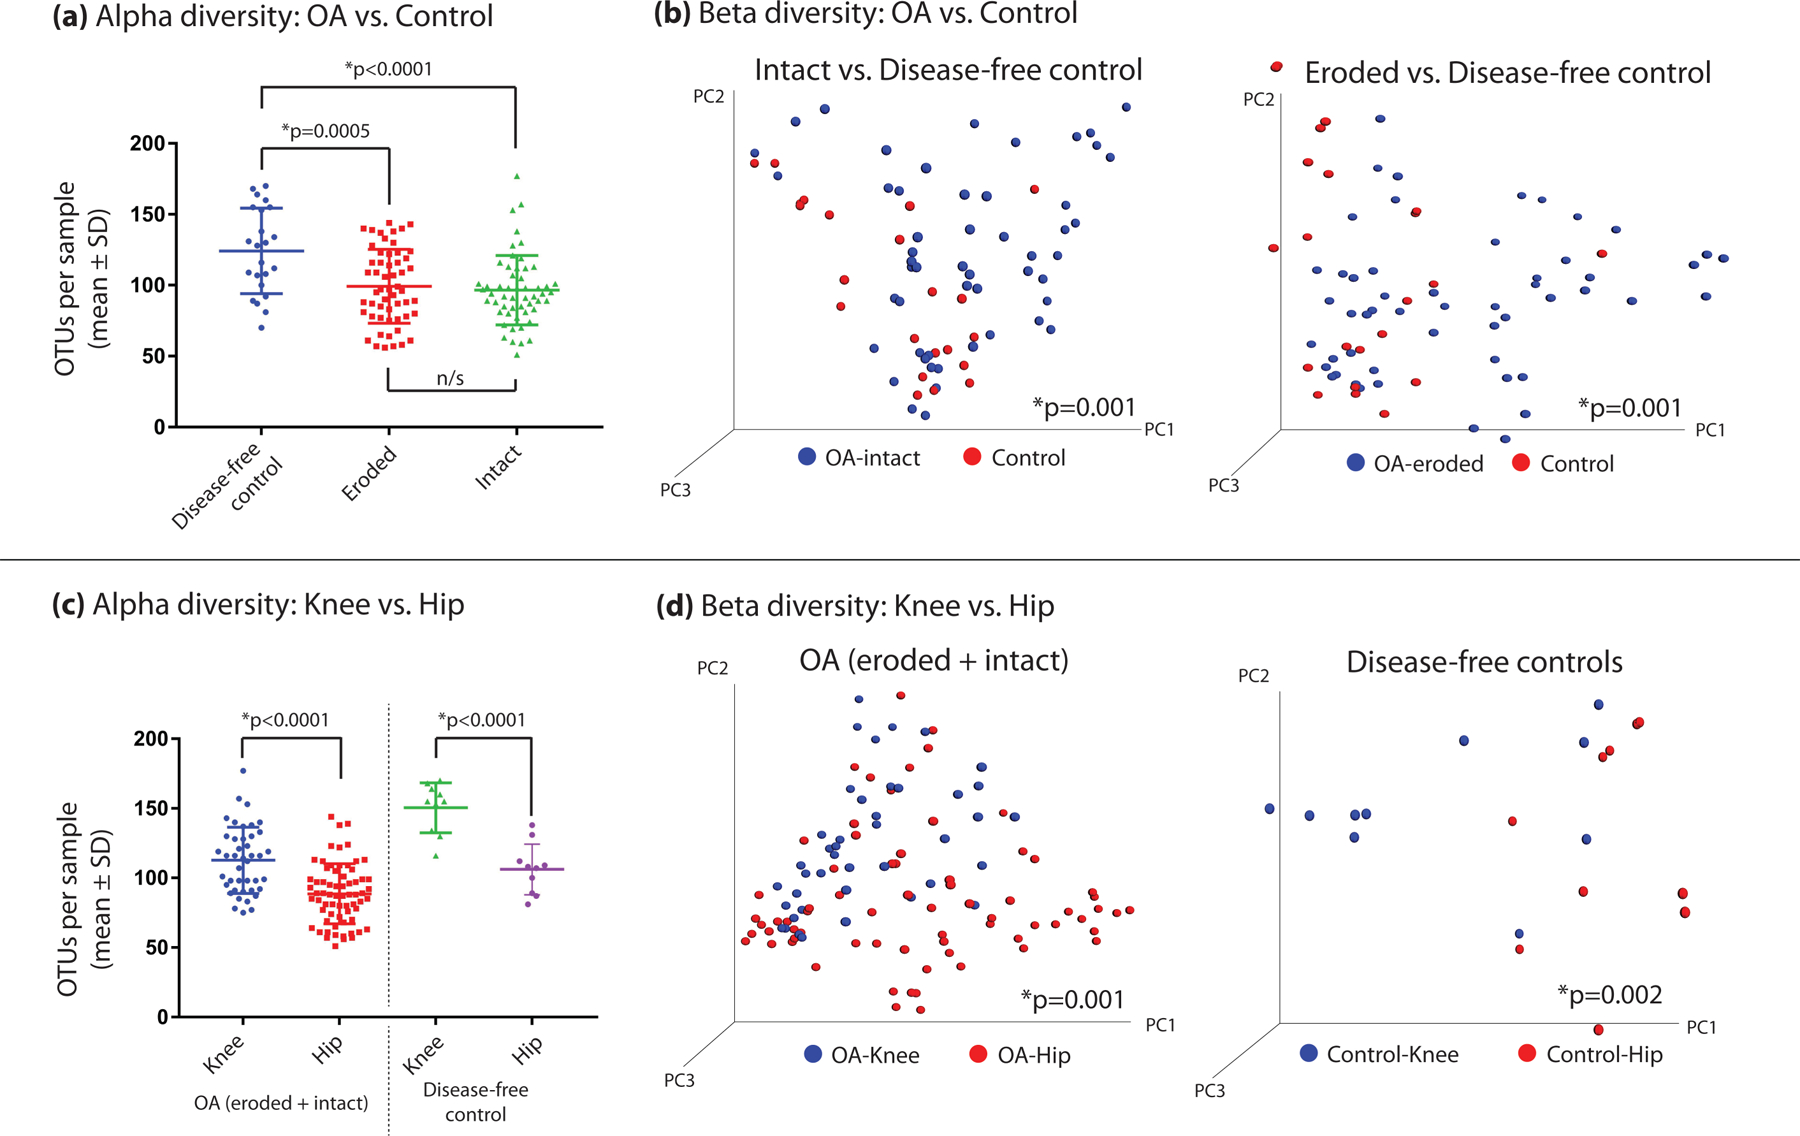
(a,b) Differences in both alpha and beta diversity among human cartilage microbial DNA clades comparing OA tissues to controls and (c,d) comparing knee tissues to hip tissues. Alpha diversity was compared using the observed OTUs method, whereas beta diversity is represented by a 3-dimensional principal component analysis, with statistical significance calculated using the Adonis method.