
Fig 1. Phenotypes of Tg-R336C Cbs−/− mice.
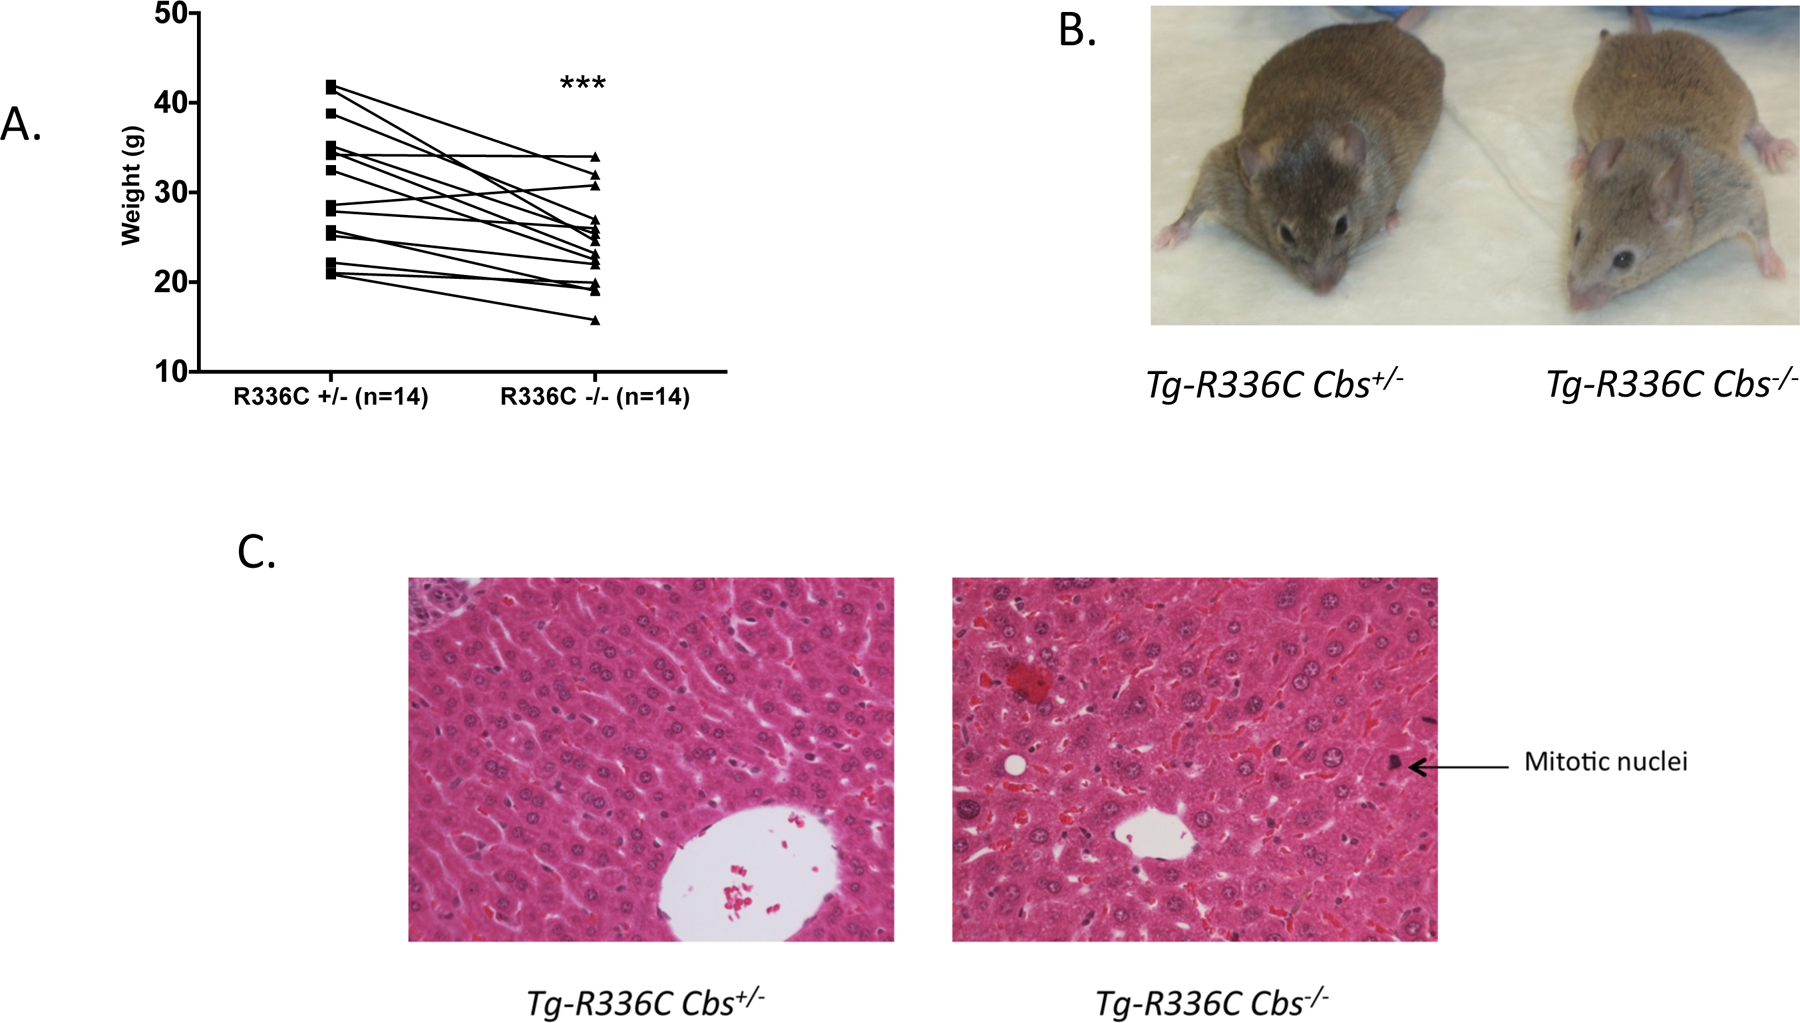
(A), Weight of age and sex matched Tg-R336C Cbs−/− mice in comparison to sibling control Tg-R366C Cbs+/−. Mice were aged between 2.2–5.3 months. *** is P<0.005 (paired t-test). (B), Photograph of a 4-month old male sibling pair of indicated genotypes. (C), Representative H & E stained liver sections of 4 month old sibling pair of the indicated genotypes at 40x magnification. Arrow indicates example of mitotic nuclei observed at a higher frequency in Tg-R366C Cbs−/− mice. Also note larger size of hepatocyte nuclei throughout section.