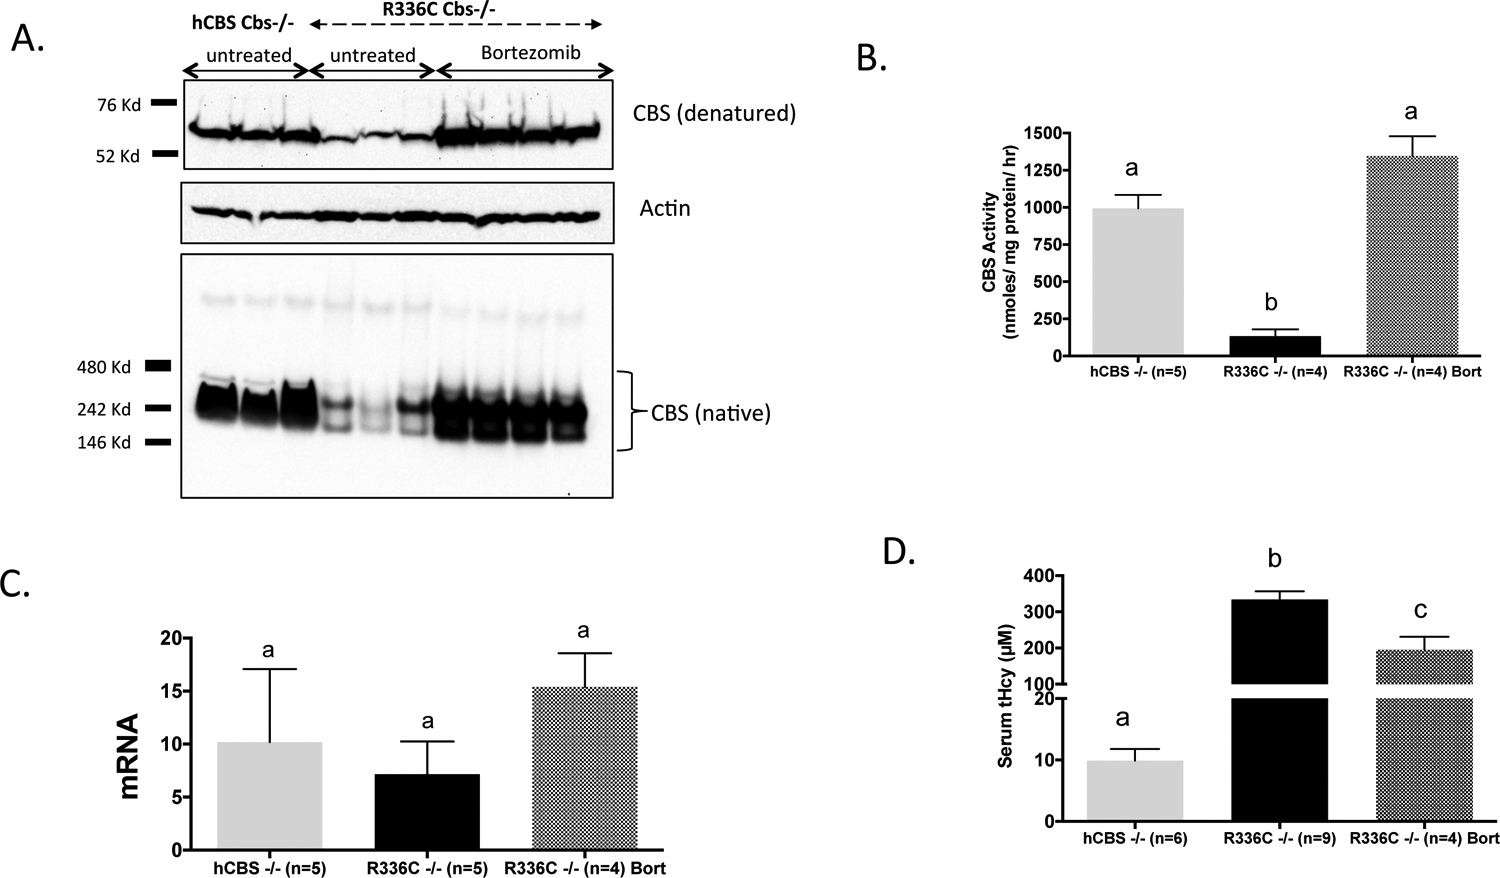
Fig 3. Analysis of p.R336C CBS protein and mRNA.

(A), Western blot of CBS expression in liver lysates of zinc-induced Tg-hCBS Cbs−/−, Tg-R336C Cbs−/−, and bortezomib treated Tg-R336C Cbs−/− mice run on denaturing (top) and native (bottom) gels. Actin was used as a loading control. Positions of molecular weight makers for each gel type is also shown. (B), CBS activity present in dialyzed crude lysates from liver of indicated genotype and treatment. Different letters at top indicate P<0.001 as judged by ANOVA followed by Tukey’s multiple comparison test. (C), Relative liver human CBS mRNA levels as determined by quantitative real time PCR using mouse actin expression as a normalizing control. (D), Serum tHcy homocysteine in indicated mice.
