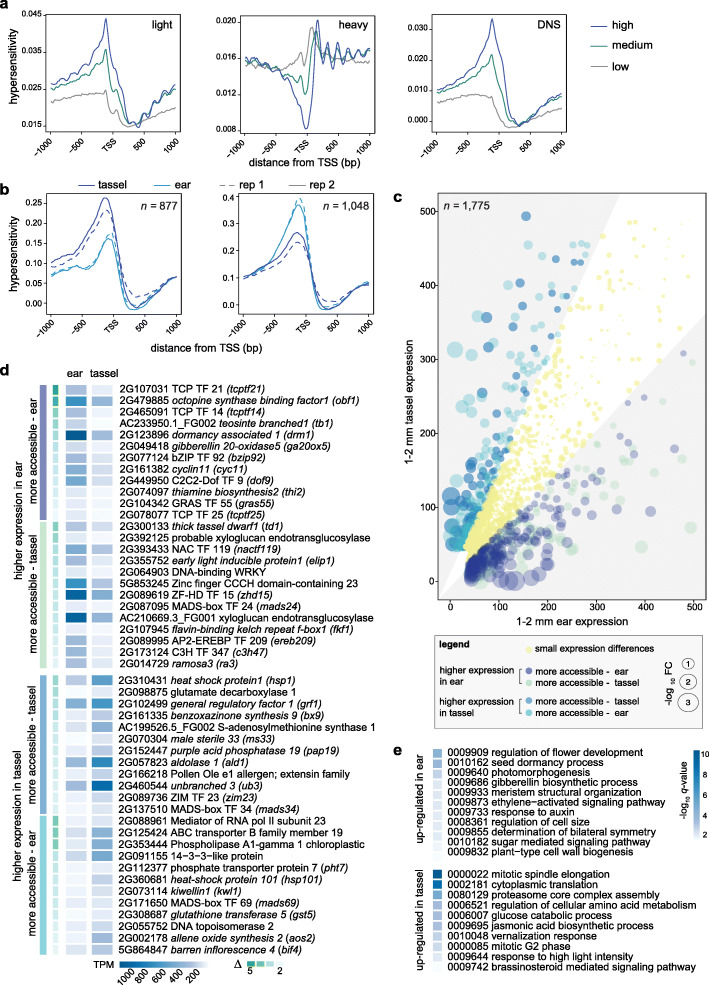
Fig. 2.
Differential MNase HS and expression changes between tassel and ear. (a) MNase HS relative to the TSS of three expression classes of PCGs in tassel. HS is plotted as average read density from the light, heavy and differential (light -heavy) MNase analysis ±1000 bp surrounding the TSS of a composite PCG model divided into 3 tertiles (high, medium and low) based on their TPM values. Results from ear are similar and presented in Fig. S7. (b) Distribution of MNase HS around the TSS of 1925 PCGs that were differentially accessible within 500 bp upstream of the TSS (877 showed increased HS in tassel and 1048 in ear). (c) Expression profiles of differentially accessible PCGs in tassel compared to ear primordia. Genes are represented as colored bubbles of different sizes (log10 fold change of gene expression between the two tissues). Bubble color indicates one of five gene classes as indicated in the legend. Gray areas in the scatterplot represent genes with a fold change difference greater than |1.5|. Genes with expression levels of > 500 TPM (n = 150) were excluded from the visualization. (d) A subset of differentially regulated PCGs and their expression profiles are grouped in four classes: more accessible and higher expression in tassel, more accessible and higher expression in ear, more accessible and lower expression in tassel, and more accessible and lower expression in ear. Genes are listed in descending order by their delta value, which represents the degree of differential accessibility in the immediate proximal promoter. Functional annotations are based on information at MaizeGBD. (e) Subset of GO categories overrepresented among differentially accessible PCGs that showed gene expression changes between tassel and ear

