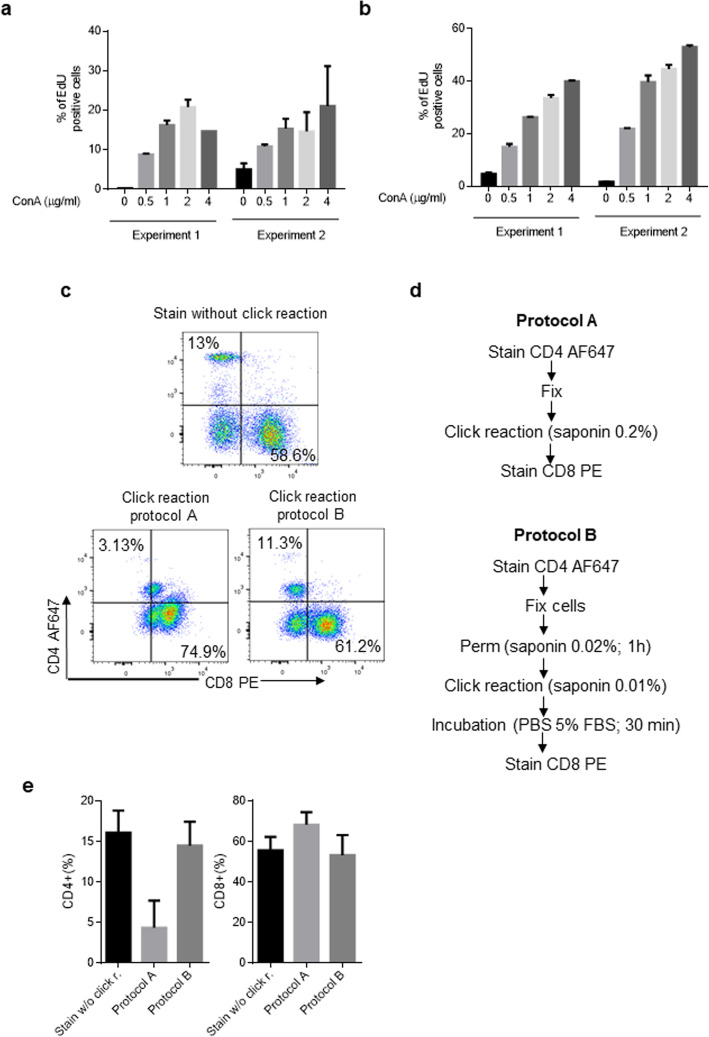
Fig. 5.
Optimization of the staining protocol. EdU was added 16 h before the end of the culture period. The cells were recovered, fixed, and stained with the click reaction components. (a) Spleen mononuclear cells, cultured in the presence of increasing concentrations of ConA (0.5 μg/mL – 4 μg/mL), were subjected to protocol A as described in Fig. 5d. The results are expressed as the mean ± standard deviation of 2 independent experiments. (b). Spleen mononuclear cells, culture in the presence of increasing concentrations of ConA (0.5 μg/mL – 4 μg/mL), were treated with protocol B as described in Fig. 5d. The results are expressed as the mean ± standard deviation of 2 independent experiments. (c) Dot plots showing the percentage of CD4+ and CD8+ cells treated with protocol A, protocol B, or from untreated fresh cells. (d) Flow chart of the staining process. (e) Quantitative data showing the effect of protocol A or B on the percentage of CD4+ or CD8+ cells as detected by flow cytometry. The results were expressed as the mean ± standard deviation of 3 independent experiments. All values shown are percentage of singlet cells. In each experiment, the cells of one chicken were analyzed. Per sample, 30,000 events were acquired on a FACSCanto II flow cytometer

