Fig. 3.
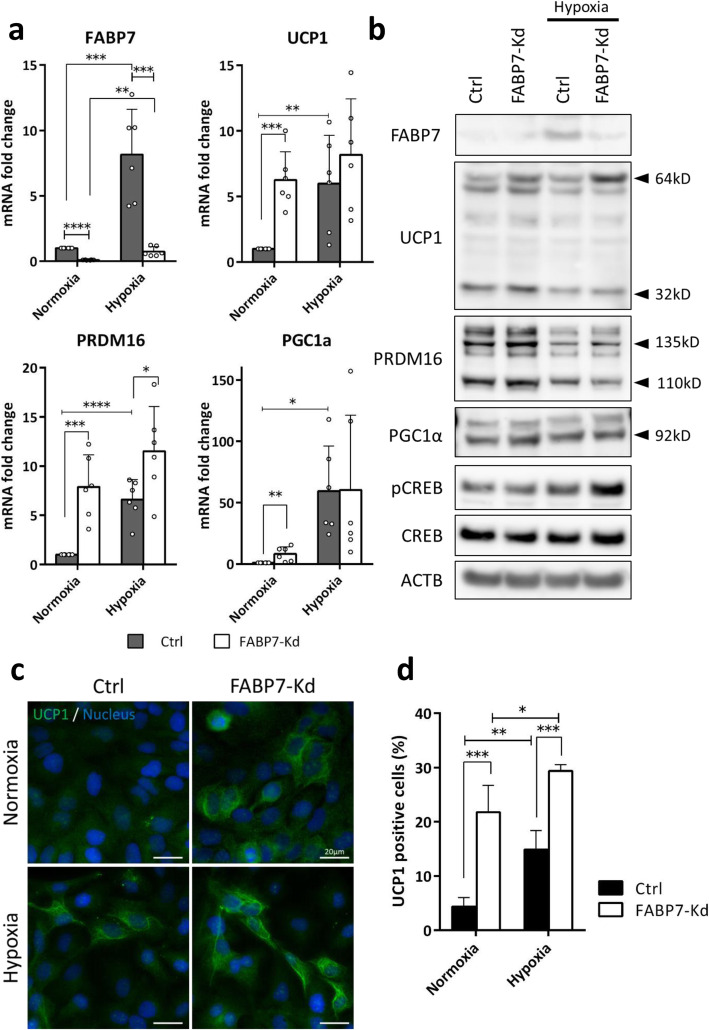
FABP7 knockdown (FABP7-Kd) and hypoxic exposure induced UCP1 expression in cancer cells. a FABP7, PRDM16, PGC-1α, and UCP1 expression in controls (Ctrl) and FABP7-Kd after 48 h normoxia or hypoxia (0.1% O2). b Representative western blots of FABP7, UCP1, PRDM16, PGC-1α, phosphorylated CREB (pCREB), and CREB after 48 h normoxia or hypoxia (0.1% O2). UCP1 bands appeared at 32 kD (monomer) and 64 kD (dimer). Four different PRDM16 isoforms were detected. c UCP1 expression (green) in cells cultured under normoxia or hypoxia (0.1% O2) for 48 h. Nuclei were stained with DAPI (blue). Scale bars; 20 μm. d Proportion of UCP1-expressing cells in Ctrl and FABP7-Kd after 48 h normoxia or hypoxia (0.1% O2). Error bars, SD; *p < 0.05, **p < 0.01, ***p < 0.001; n = 3

