Fig. 5.
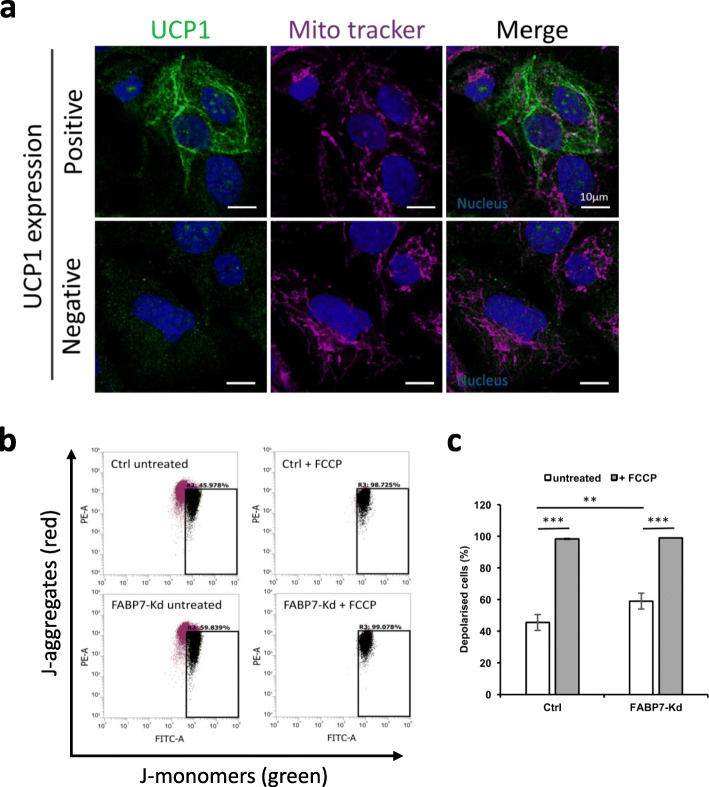
UCP1 caused focal depolarization of mitochondria. a Representative confocal microscopic images of UCP1-expressing cells (upper panels) and UCP1-negative cells (lower panels) acquired from FABP7 knockdowns (FABP7-Kd). UCP1 expression, polarized mitochondria (Mito Tracker), and nuclei are indicated in green, magenta, and blue, respectively. Scale bars; 10 μm. b Representative scatterplots of JC-1 assay. X and y axes show green (JC-1 monomer) and red (J-aggregate) fluorescence, respectively. The gate named depolarized was used for calculating the proportion of depolarized cells. c Proportion of depolarized cells in Ctrl and FABP7-Kd calculated through JC-1 assay. Error bars, SD; **p < 0.01, n = 6

