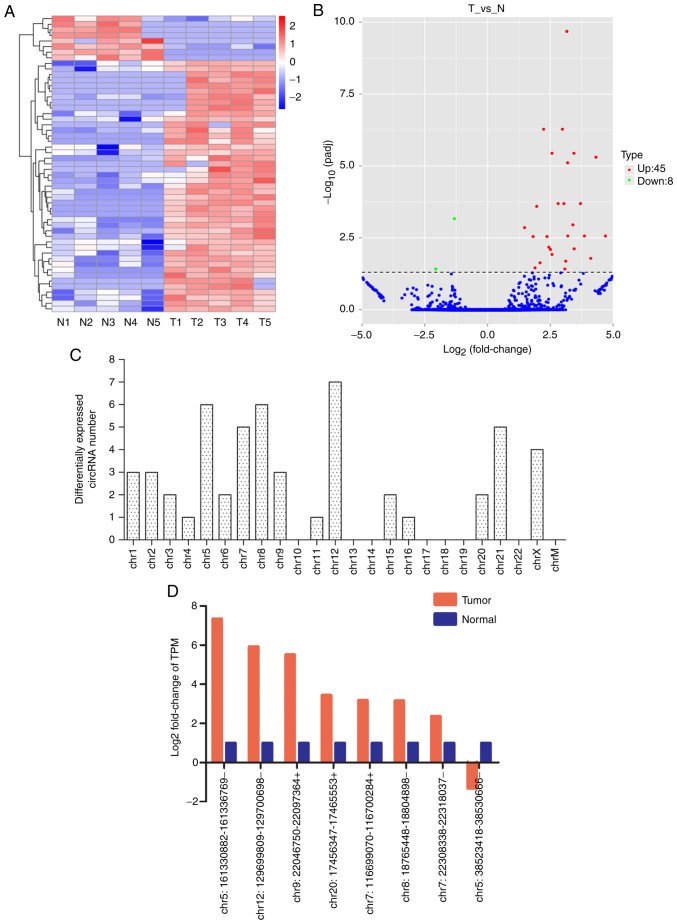
Figure 2.
Overview of the circRNA profiles (N, normal thyroid tissues; T, tumour thyroid tissues; chr, chromosome). (A) Hierarchical cluster analysis of differentially expressed circRNAs. The red and blue colours indicate high and low expression, respectively. (B) Volcano plot of differentially expressed circRNAs in PTC. The dotted line represents P=0.05. The red and green points represent circRNAs that were significantly upregulated or downregulated, respectively. (C) Chromosomal distributions of differentially expressed circRNAs. (D) RNA sequencing data of 8 circRNAs. PTC, papillary thyroid carcinoma; circRNA, circular RNA.

