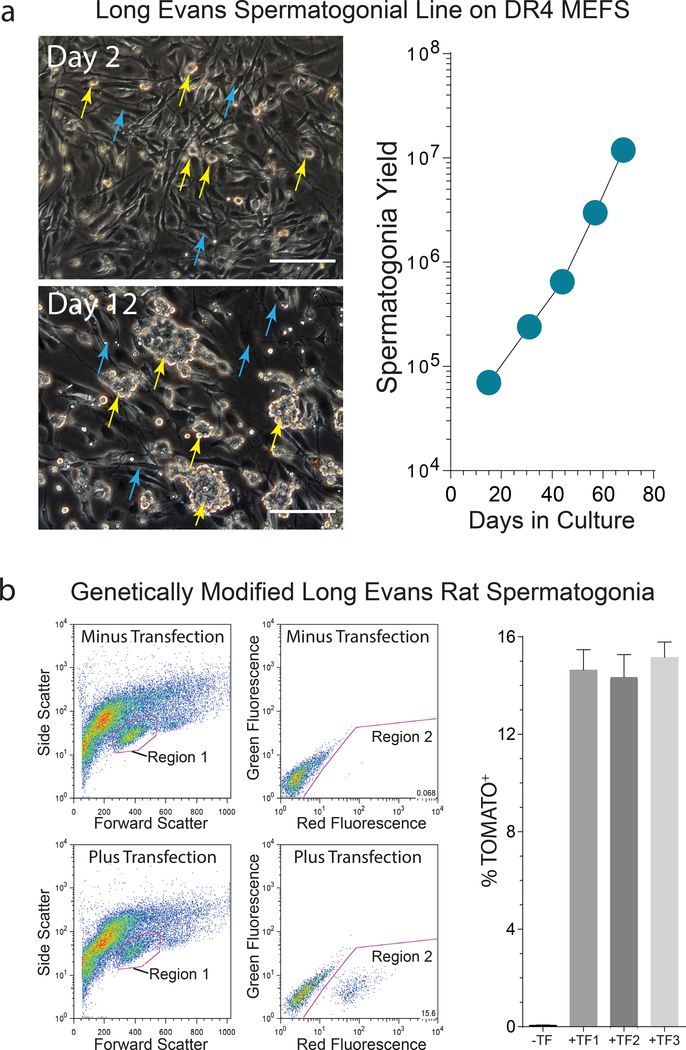
Figure 2. Long Evans rat spermatogonial sub-culture and genetic modification.
a) Left: Laminin-Binding spermatogenic cells illustrated in Figure 1 were used to derive Long Evans rat spermatogonial lines that develop into colonies (yellow arrows) on MEF feeder layers (cyan arrows). Scale, 40 μm. Right: Propagation of a Long Evans rat spermatogonial line during sub-culture on MEFs. Graph depicts spermatogonial yield following passages 1–5 on MEFs.
b) Flow analysis of a Long Evans rat spermatogonial line following transfection with pSBDazl-tdTomato (SB transposon) + pSBM3A (SB transposase) plasmids. Left: Red Fluorescence intensity (Region 2) in cells gated from Region 1 in adjacent forward and side scatter plots following transfection with pSBDazl-tdTomato + pSBM3A plasmids (Plus Transfection). Untransfected spermatogonia from the same culture were used to define Region 2 (Minus Transfection). Right: percent tdTomato+ cells in Region 2 scatter plots at passage 4 following co-transfection with pSBDazl-tdTomato and pSBM3A (+TF; ±SEM, n=3 transfections/spermatogonial line) -TF, Minus Transfection culture used to determine background fluorescence.

