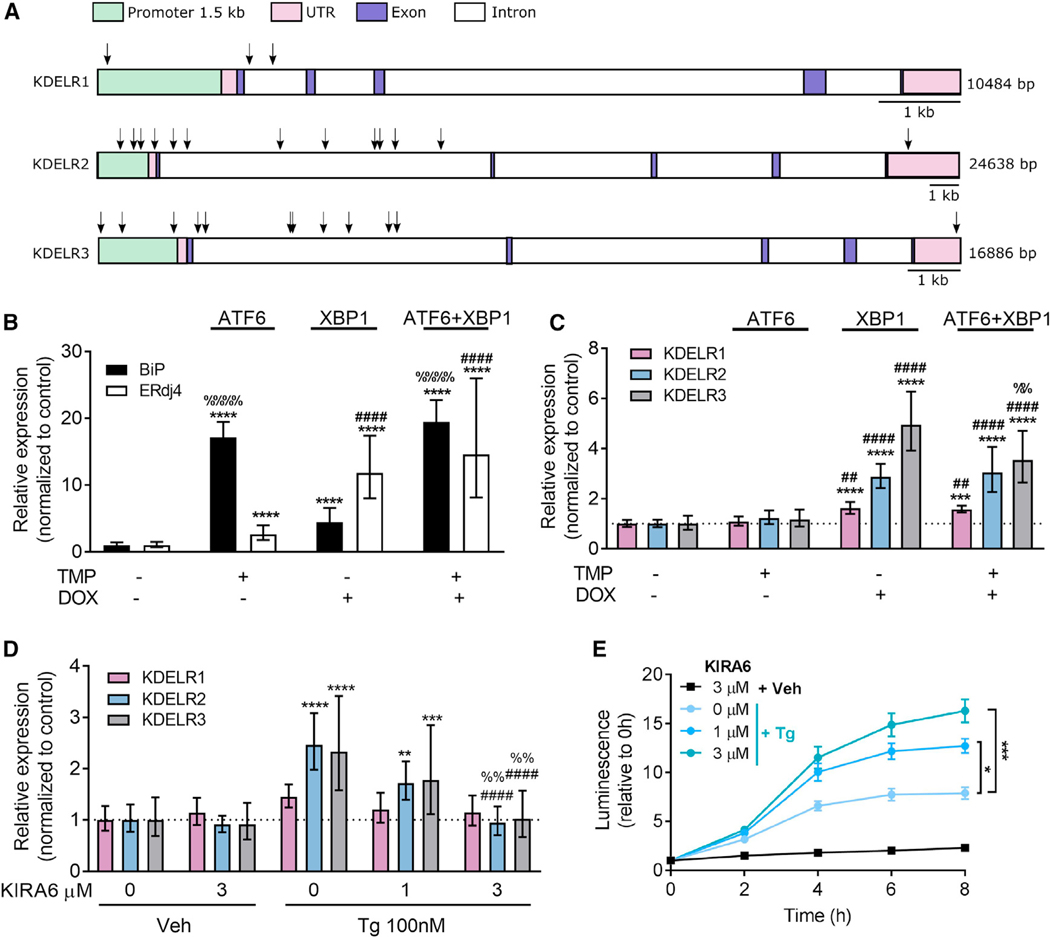
Figure 6. XBP1 Upregulates KDEL Receptor Expression.
(A) Schematic figure of putative binding sites for XBP1 in the KDEL receptor genes (arrows).
(B and C) ATF6 and XBP1 activity was induced in HEK293DAX cells by a 16 hr incubation in 10 mM trimethoprim (TMP) and/or 1 μg/mL doxycycline (DOX), and expression levels of (B) BiP and ERdj4 and (C) KDEL receptors were analyzed using real-time RT-qPCR (n = 8–9).
(D) XBP1 splicing was inhibited by a 1hr pretreatment with 1 or 3 μM KIRA6, and changes in KDEL receptor expression were assessed after exposure of SH-SY5Y cells to 100 nM Tg for 8 hr (n = 6–9).
(E) Extracellular GLuc-ASARTDL from cells described in (D) (n = 6).
All transcription results are shown as 2−ddCq (mean ± upper and lower limit) with *p < 0.05, **p < 0.01, ***p < 0.001, and ****p < 0.0001 versus control groups using two-way ANOVA followed by Tukey’s test. In (B) and (C): ##p < 0.01, ####p < 0.0001 as compared to TMP only, and %%p < 0.01, %%%%p < 0.0001 as compared to DOX only. In (D): ####p < 0.0001 as compared to 0 mM KIRA6/Tg and %%p < 0.01 as compared to 1 μM KIRA6/Tg. See also Figure S6 and Table S1.

