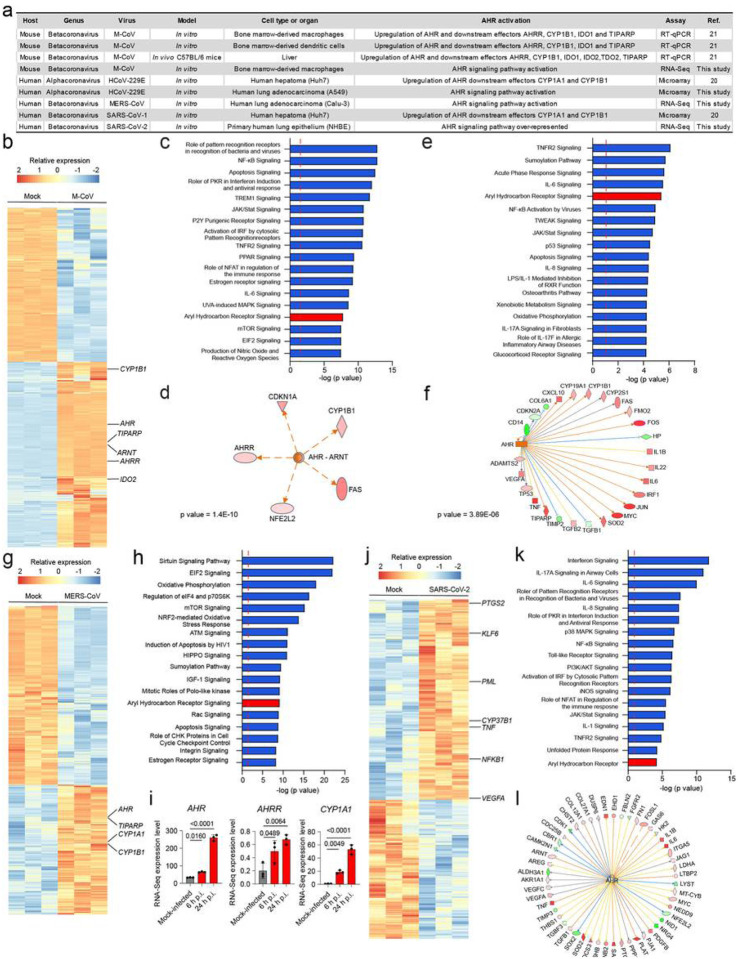
Figure 1.
AHR signaling is associated to infection with multiple coronaviruses. (a) Activation of AHR signaling upon infection with different members of the Alphacoronavirus and Betacoronavirus genus of the Coronaviridae family (b) Heatmap showing gene expression detected by RNA-seq analysis of mock-infected and M-CoV-infected bone marrow-derived macrophages (n=3 independent experiments per condition) (c) Ingenuity pathway analysis (IPA) of pathways enriched in M-CoV-infected cells compared to mock-infected cells (n=3 independent experiments per condition). Dashed red line indicates p=0.05. p values were determined using a Fisher’s exact test. (d) IPA identifies AHR as an upstream regulator. p value was determined using a Fisher’s exact test. (e) IPA of pathways enriched in HCoV-229E- infected cells compared to mock-infected human lung adenocarcionma (A549) cells (n=3 independent experiments per condition). Dashed red line indicates p=0.05 (f) IPA identifies AHR as an upstream regulator in the infected samples. p value was determined using a Fisher’s exact test. (g) Heatmap showing gene expression detected by RNA-seq analysis of mock-infected and MERS-CoV-infected human lung adenocarcinoma (Calu-3) cells (n=3 independent experiments per condition) (h) IPA of pathways enriched in MERS-CoV-infected cells compared to mock- infected cells (n=3 independent experiments per condition). Dashed red line indicates p=0.05. p values were determined using a Fisher’s exact test. (i) Expression levels of AHR, AHRR and CYP1A1 determined at different times post infection by RNA-Seq (n=3 independent experiments per condition) (j) Heatmap showing gene expression detected by RNA-seq analysis of mock-infected and SARS-CoV-2-infected human primary lung epithelium cells (n=3 independent experiments per condition) (k) IPA of pathways enriched in SARS-CoV-2-infected cells compared to mock-infected cells (n=3 independent experiments per condition). Dashed red line indicates p=0.05. p value was determined using a Fisher’s exact test. (l) IPA identifies AHR as an upstream regulator in the infected samples. p value determined using a Fisher’s exact test.

