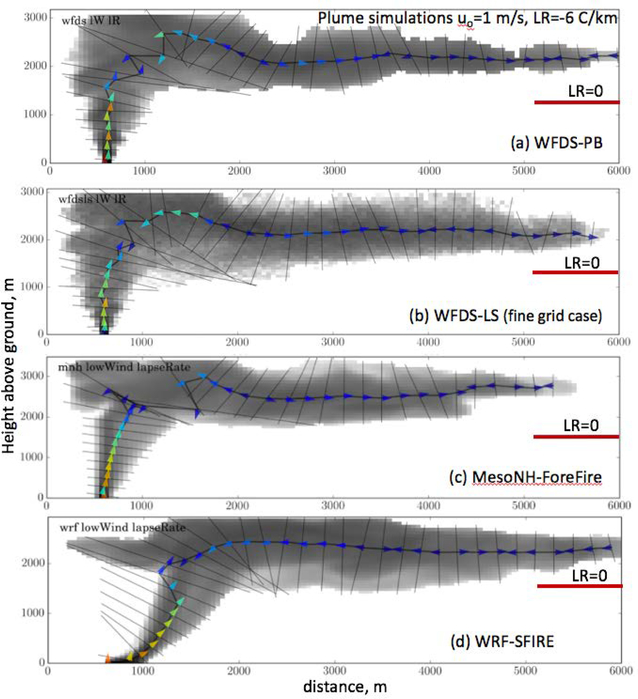
Figure 6.
Simulated smoke plumes at time t = 1000 s after ignition of the stationary line fire. u0 (m/s) and LR (°C/km) are wind speed constant and lapse rate. Note that unlike Figure 5, in this figure the shading, centerline, and convective flux are for a lapse rate of −6 °C/km, not 0 °C/km; the thick magenta line shows the height of the plume centerline for LR = 0 °C/km. The shading is smoke plume with darkness degree increasing with smoke concentration.

