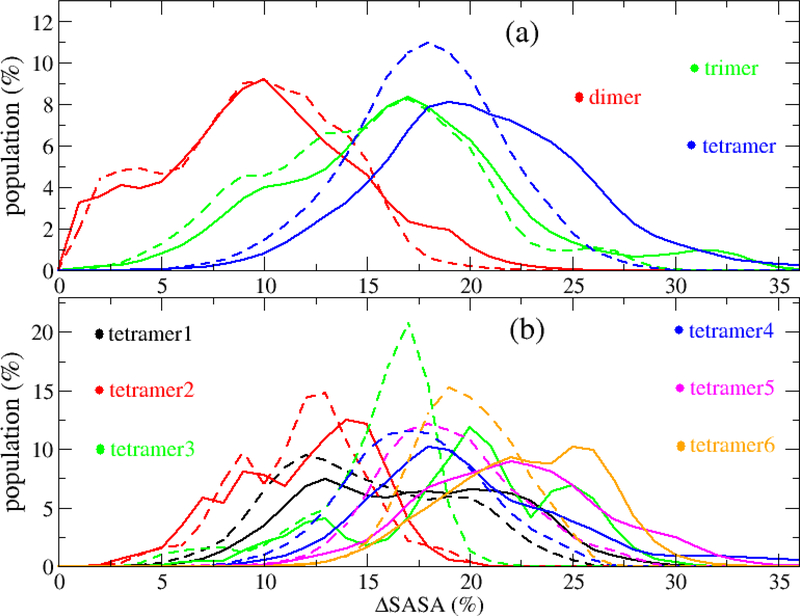
Figure 11:
The distribution of lost SASA (ΔSASA) for Aβ42 dimer, trimer and tetramer (a), and for different tetramer CP types (b). The solid and dash lines represented for the ΔSASA of hbSASA (ΔhbSASA) and pSASA (ΔpSASA), respectively. The ΔSASA is percentage of the SASA which was lost when the oligomer form in comparison with the sum of all monomers whose SASA were calculated separately. The data was collected from all the 500-ns MD simulations for all the systems.

