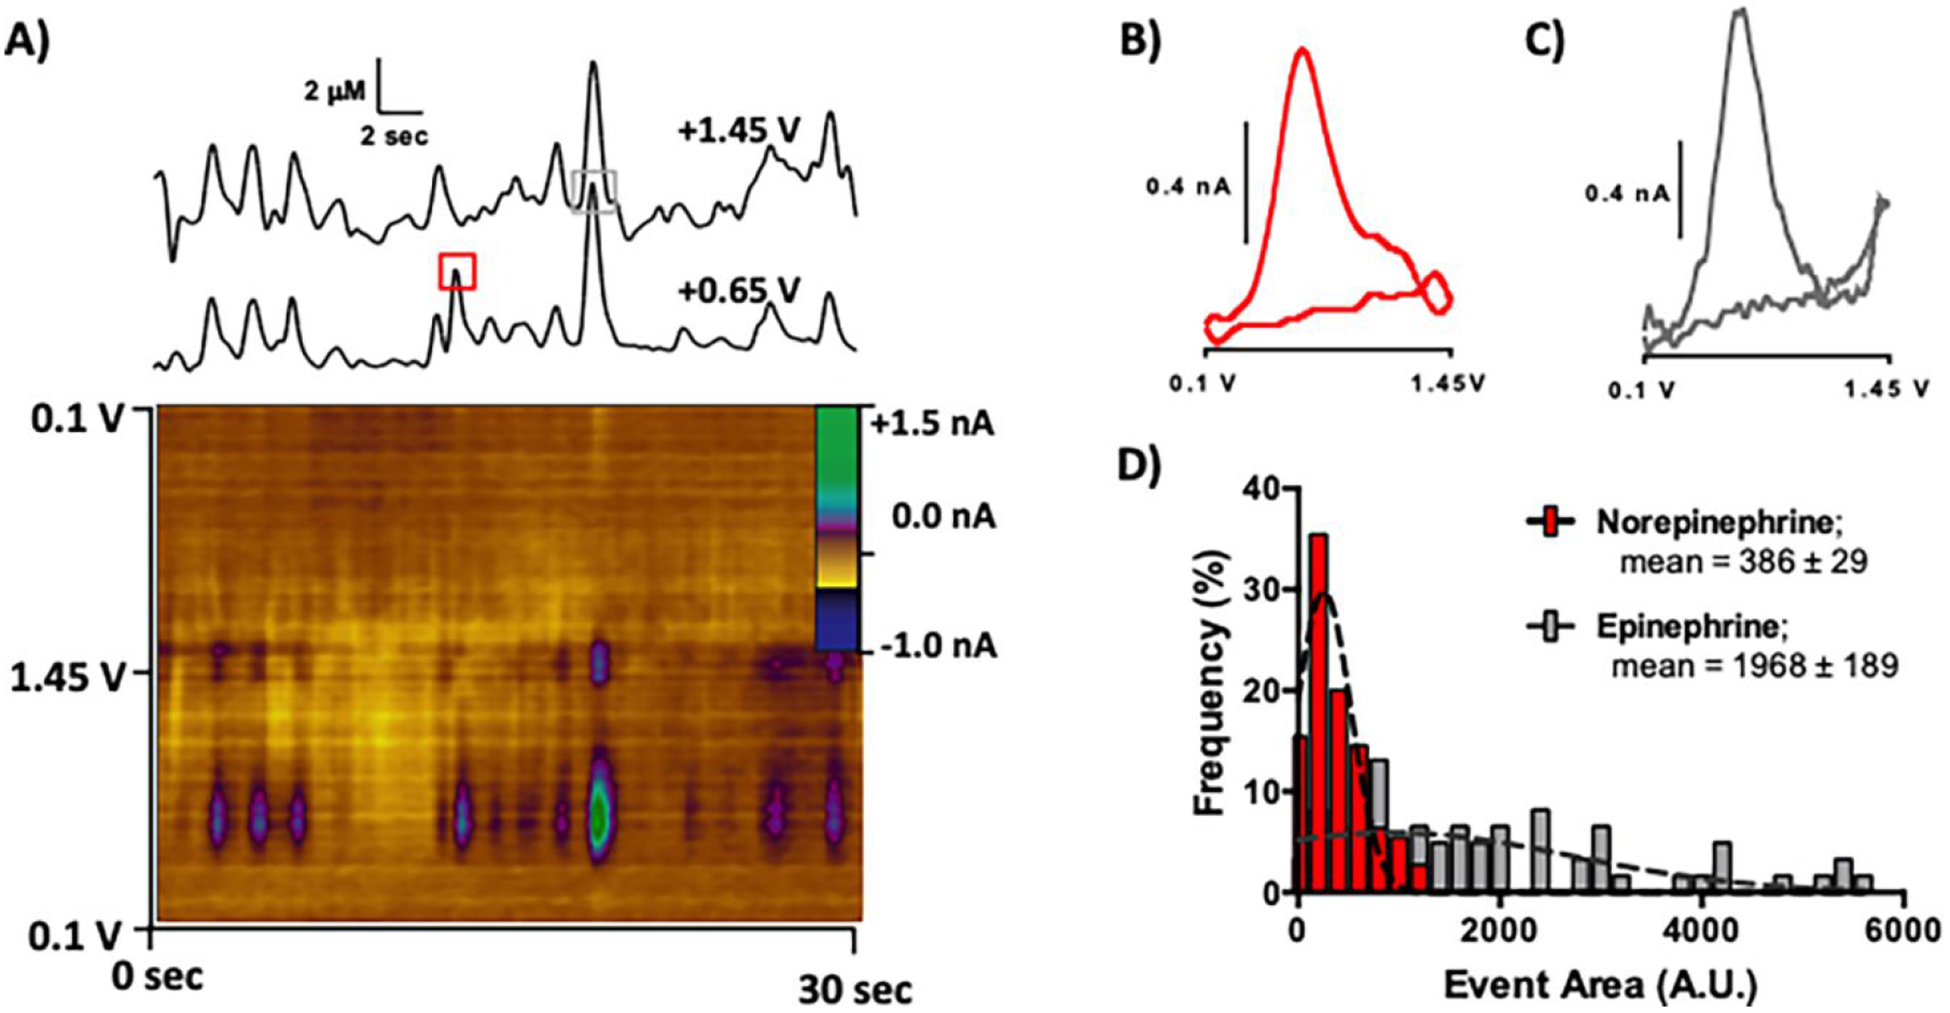
Figure 6.

Classification of the catecholamine content in individual secretory vesicles. A) Representative color plot collected in the chromaffin cell cytoplasm using a waveform with potential limits from +0.1 V - +1.45 V, applied at 800 V/s. Concentration vs. time traces are shown above the color plot, top: +1.45 V, bottom: t +0.65 V. Voltammograms from the color plot are shown for B) norepinephrine and C) epinephrine, collected at the time points marked by the red and gray squares, respectively. D) Histogram of a lognormal distribution of event area for norepinephrine events (n=124) and for those that resulted in detection of at least some epinephrine (n=71 events, Student’s t-test, ****p < 0.0001).
