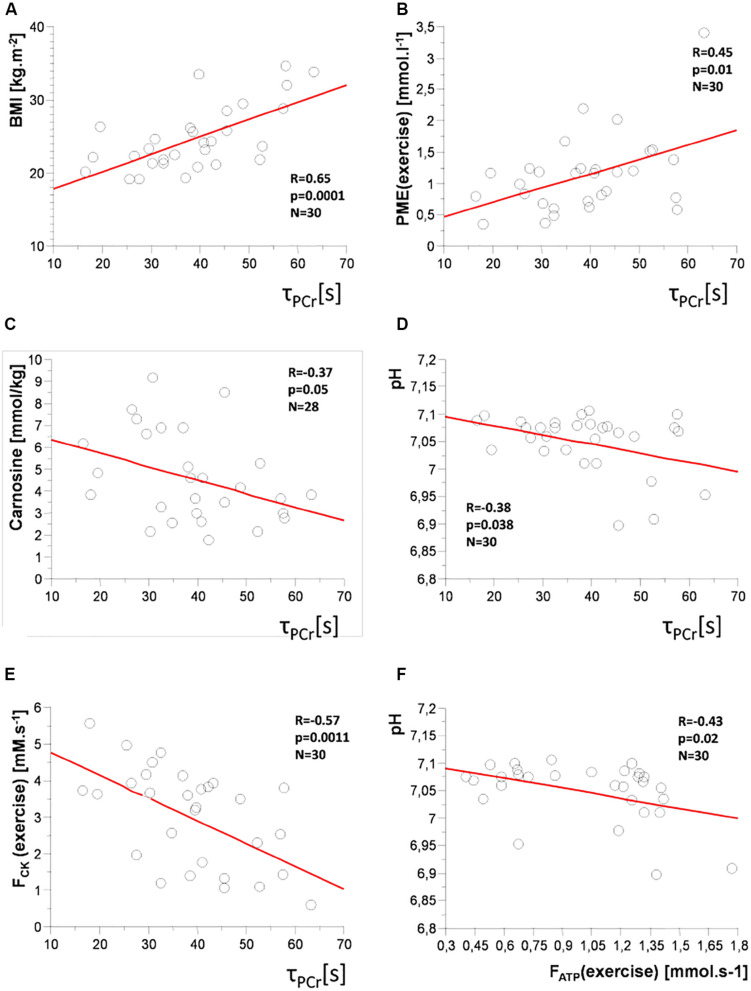
FIGURE 6.
Correlation plots: time constant of PCr recovery (τPCr) with (A) body mass index (BMI); (B) concentration of phosphomonoesters (PME) during exercise; (C) muscle carnosine concentration; (D) pH; (E) PCr-to-ATP flux (FCK) during exercise, and (F) between Pi-to-ATP flux (FATP) and pH during exercise.

