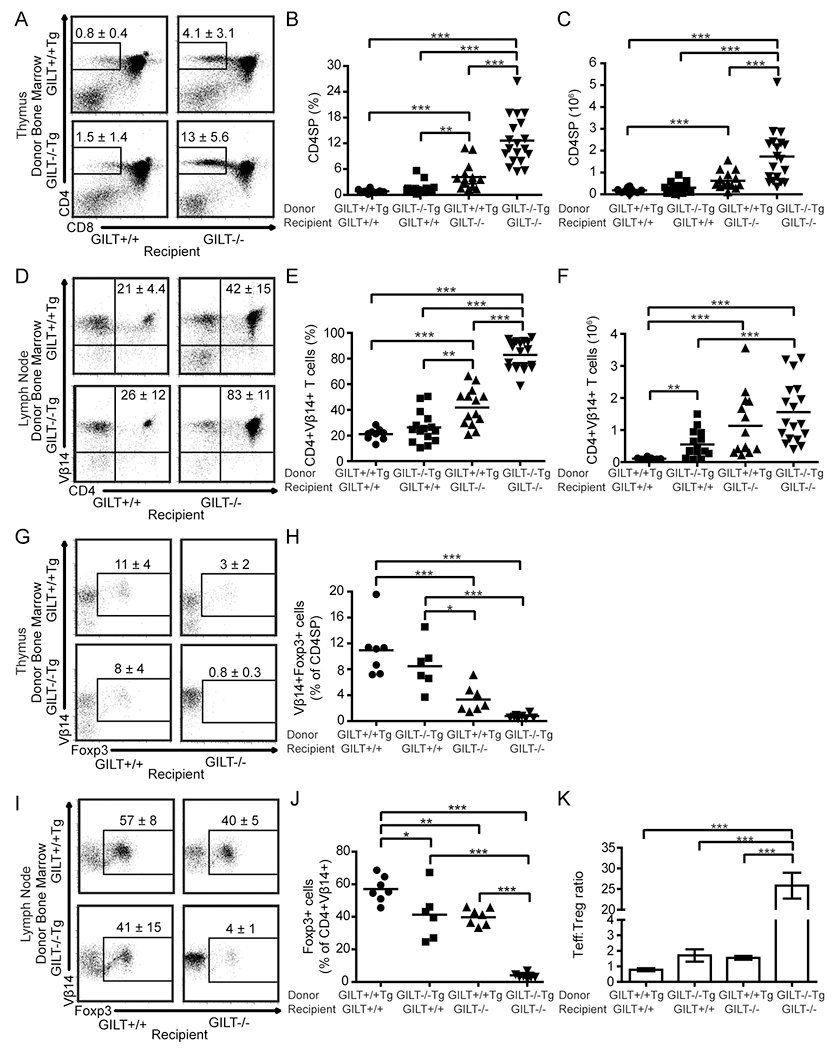
Figure 4. GILT in TECs is necessary for efficient deletion of TRP1-specific T cells.

To limit T cell specificity to TRP1 and assess the development of TRP1-specific T cell tolerance, all donor and recipient animals in these studies were on the RAG−/− background and expressed TRP1 Ag. Lethally irradiated RAG−/− or GILT−/−RAG−/− mice were reconstituted with bone marrow from Ag+GILT+/+Tg or Ag+GILT−/−Tg mice. Thymocyte and lymph node cell subsets were analyzed eight weeks later. (A) Representative dot plots demonstrating the gating and mean frequency ± SEM of CD4SP cells in the thymus. (B) Frequency and (C) absolute number of CD4SP thymocytes (D) Representative dot plots demonstrating the mean frequency ± SEM of CD4+Vβ14+ lymph node cells. (E) Frequency and (F) absolute number of CD4+Vβ14+ lymph node cells. Data points (B, C, E, F) represent individual mice from three pooled experiments. (G) Representative dot plots demonstrating the mean frequency ± SEM of CD4SP thymocytes that are Vβ14+Foxp3+. (H) Frequency of Vβ14+Foxp3+ cells within CD4SP thymocytes. (I) Representative dot plots showing the mean frequency ± SEM of CD4+Vβ14+ lymph node cells that express Foxp3. (J) Frequency of TRP1-specific Treg cells in lymph nodes. (K) Tconv:Treg cell ratio in lymph nodes. Data points in (H, J, K) represent individual mice from two additional experiments. Groups were compared by ANOVA with the Bonferroni correction for multiple comparisons. *, p < 0.05, **, p < 0.01, ***, p < 0.001.
