
FIGURE 2.
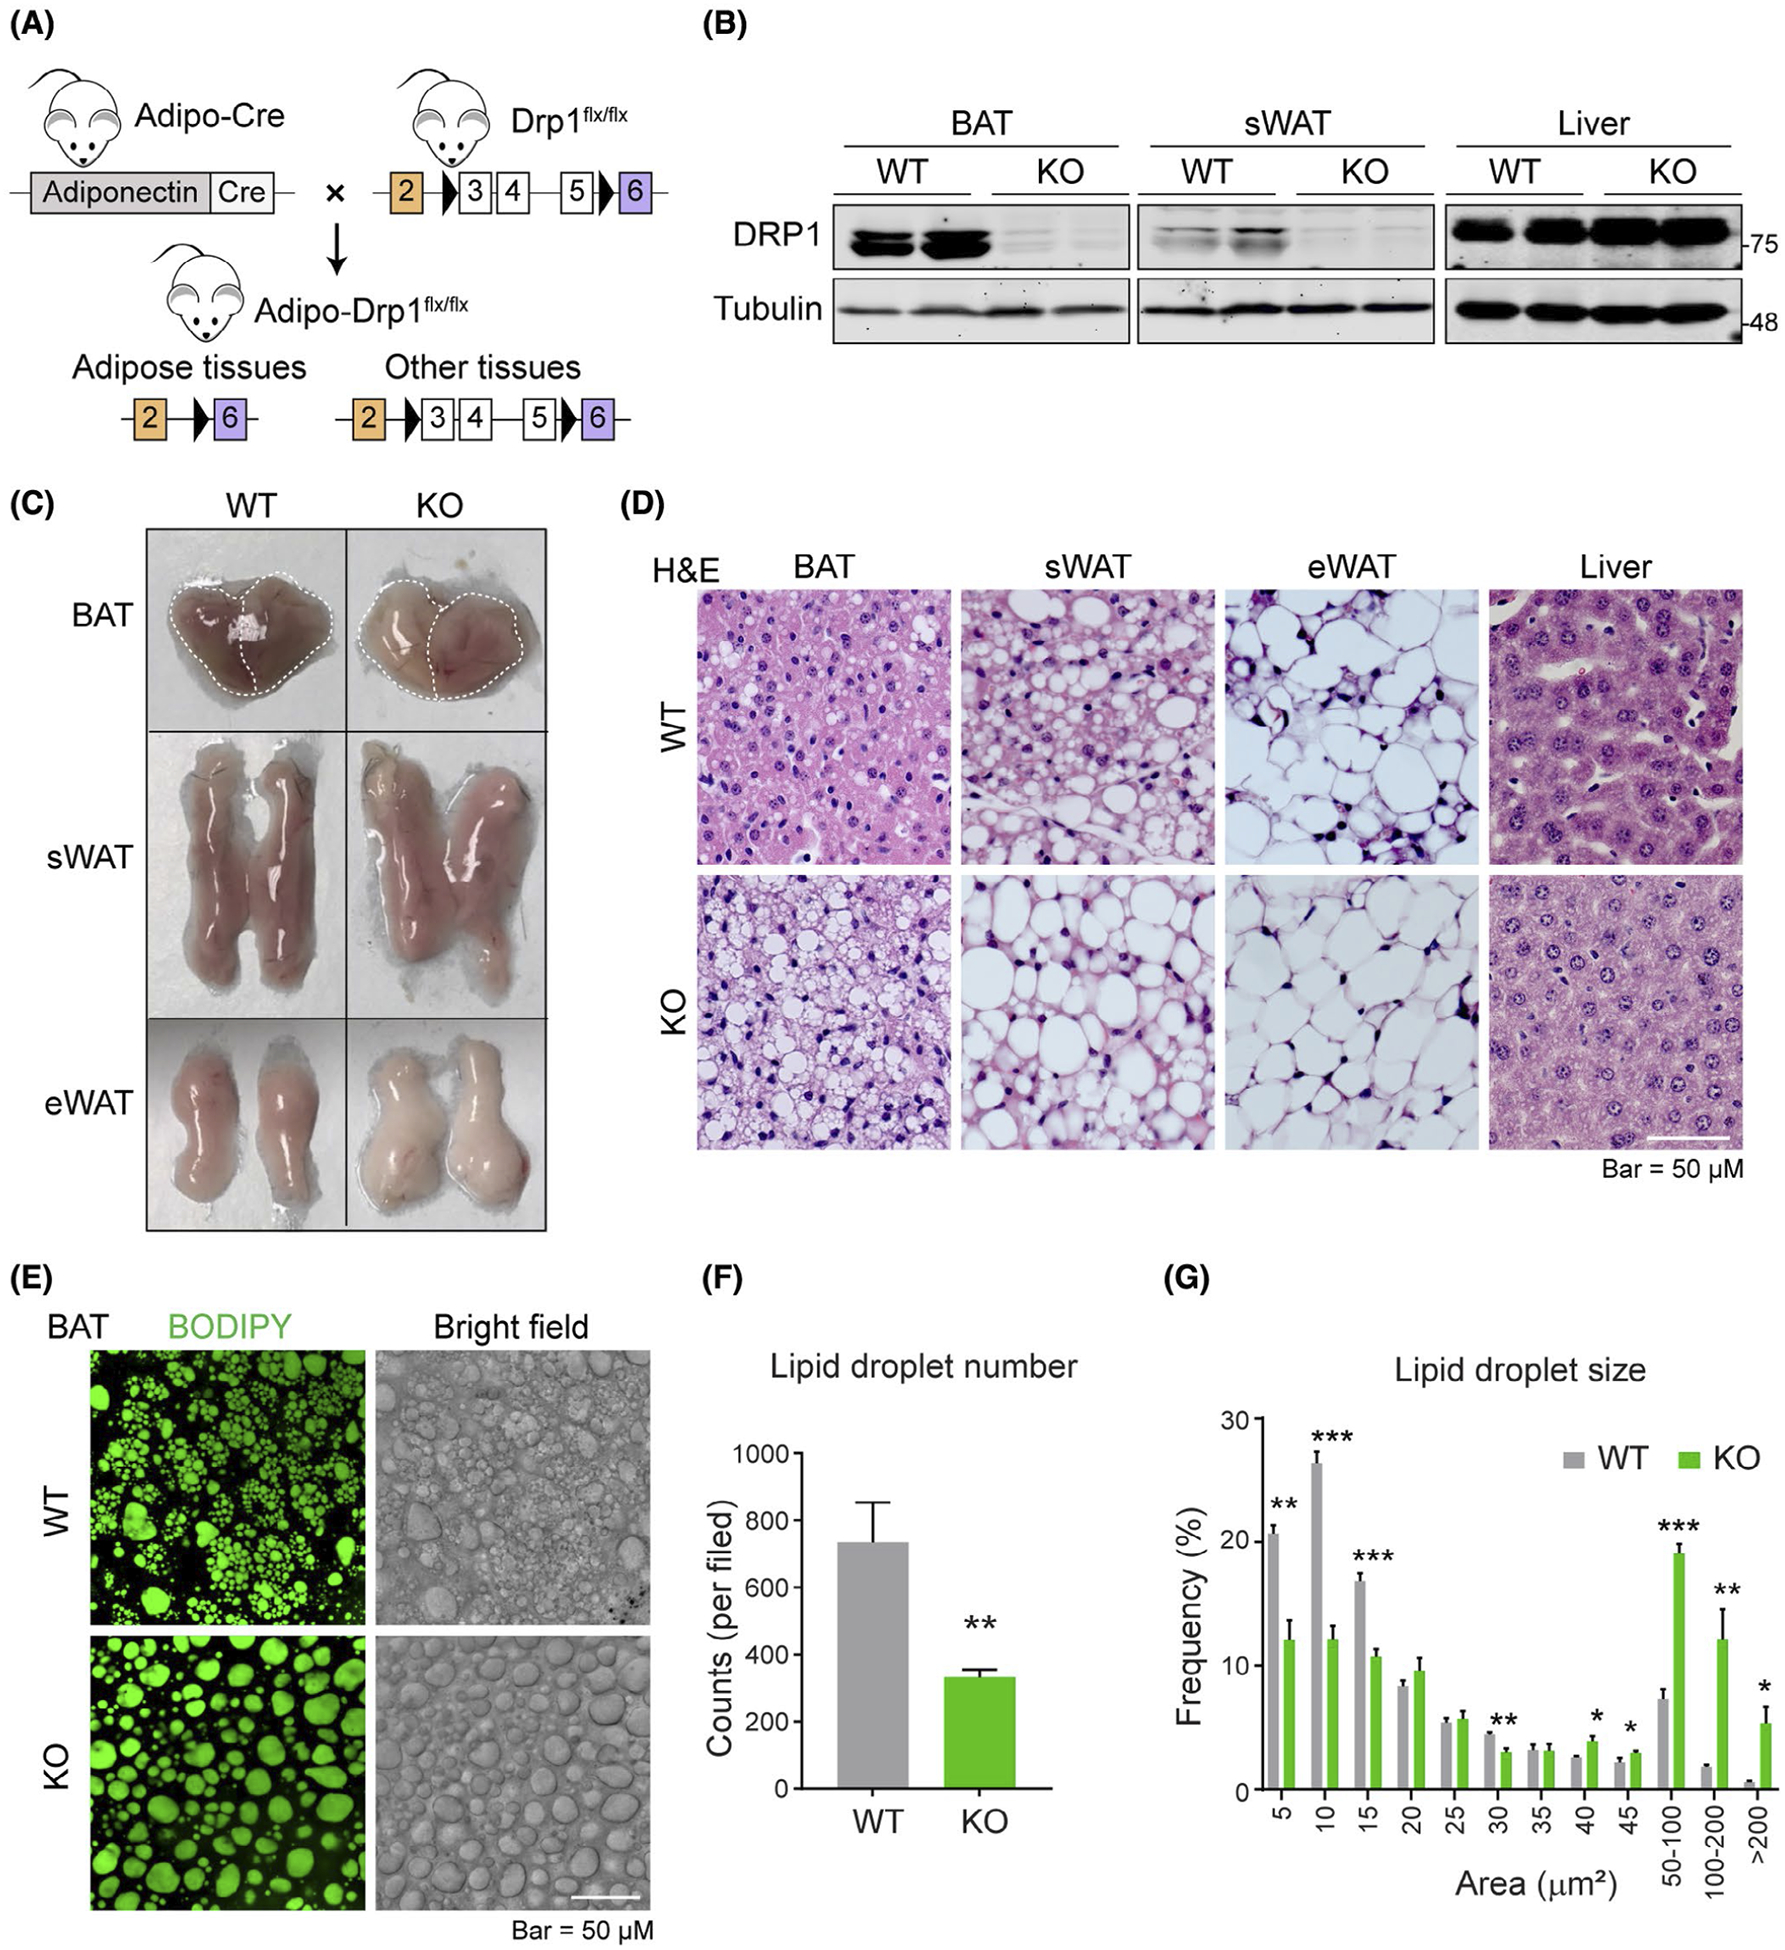
Adipose tissue-specific Drp1 knockout mice exhibit unusually large LDs in adipocytes upon cold exposure. A, Schematic representation of adipocyte-specific DRP1 knockout (Adipo-Drp1flx/flx) mouse model. B, Western blotting analysis of DRP1 and Tubulin protein levels in the brown adipose tissue (BAT), sWAT, and liver from Adipo-Drp1flx/flx mice (KO) and their littermate controls (WT). Tubulin was used as the loading control (n = 6 per group, the sample loaded in each lane contains pooled samples from three mice, representative of three trials).C, Images of the BAT, sWAT, and epididymal white adipose tissue (eWAT) from Adipo-Drp1flx/flx mice (KO) and their littermate controls (WT) after cold exposure (Representative of six mice). D, H&E staining for the BAT, sWAT, eWAT, and liver from Adipo-Drp1flx/flx and their littermate control mice after cold exposure (Representative of 5 fields of the samples from six mice per group). E, BODIPY staining of lipid droplets (LDs) and bright filed images in the BAT explants from Adipo-Drp1flx/flx mice and their littermate controls after cold exposure. F, Quantification of lipid droplet number in (E) (n = 5, data are represented as mean ± SEM, Student’s t test, **P < .01). G, Quantification and distribution of lipid droplet size in (E) (n = 5, data are represented as mean ± SEM, Student’s t test, *P < .05, **P < .01, ***P < .001)