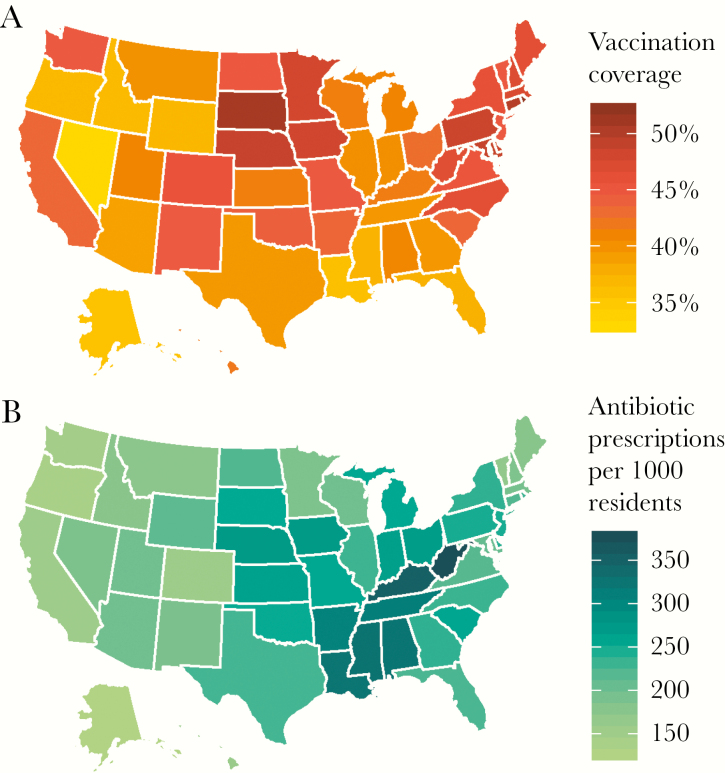
Figure 2.
Influenza vaccination coverage and antibiotic consumption rate by state, United States, 2016–2017. A, Cumulative influenza vaccination rate from August to January of the 2016–2017 influenza season. B, Number of antibiotic prescriptions per 1000 residents aggregated for the months of January 2017 to March 2017. Source: Centers for Disease Control and Prevention FluVaxView, IQVIA Xponent, 2000–2015, IQVIA Inc. All rights reserved.

