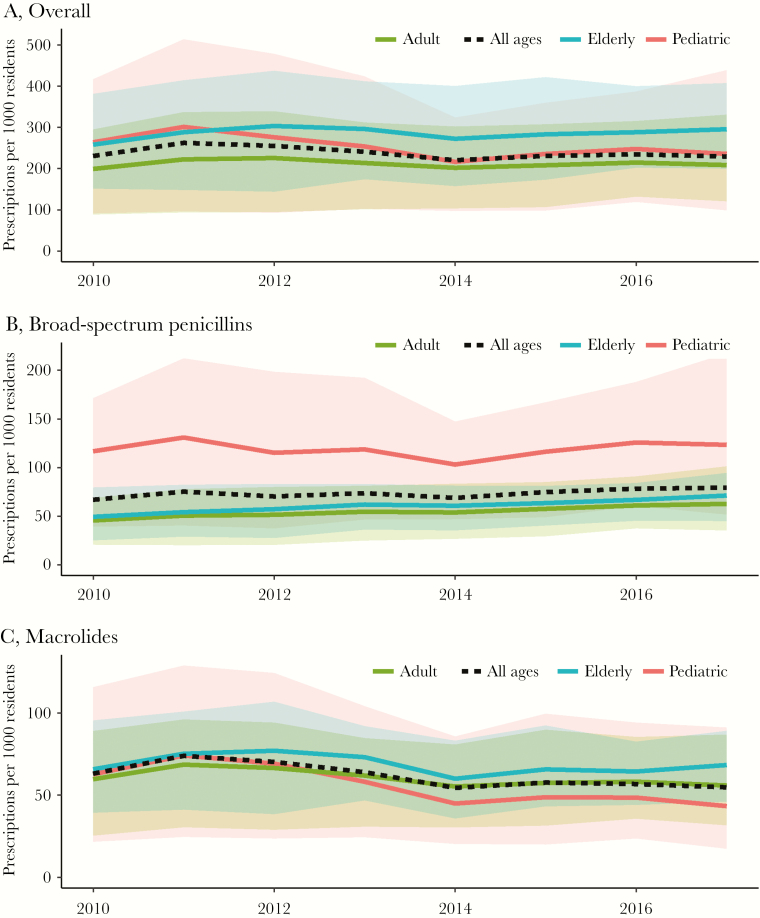
Figure 3.
Mean state-level antibiotic consumption rate from 2010 to 2017 by age group, United States. The antibiotic consumption rate was defined as the number of prescriptions per 1000 residents. Each line represents the mean state-level number of antibiotic prescriptions per 1000 residents from January to March across all 50 states and the District of Columbia; the corresponding shaded regions depict the minimum and maximum values for each age group. Overall, the elderly had a slightly higher consumption rate (A), though the pediatric age group had much higher rates of broad-spectrum penicillin consumption (B) and lower rates of macrolide consumption (C). Source: IQVIA Xponent, 2000–2015, IQVIA Inc. All rights reserved.

