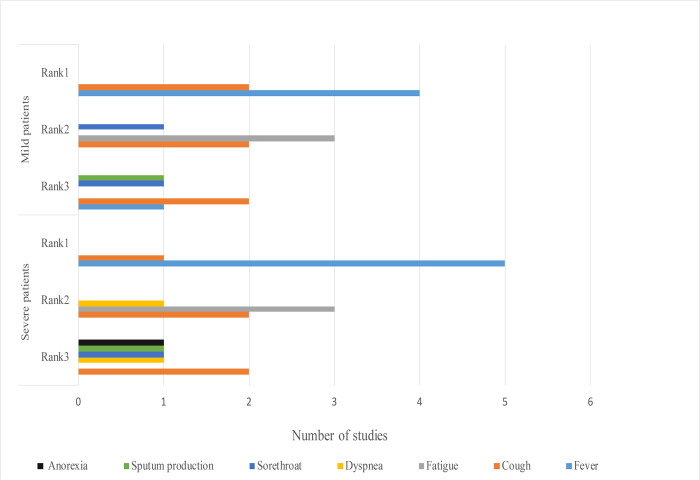
Figure 3.
Comparison of top 3 symptoms among mild and severe patients with COVID-19, 2020* *The X-axis means the number of symptoms reported by how many studies. The Y-axis means symptoms’ ranking in mild and severe patients. In this circumstance, rank means the order judged by the frequency of the symptoms reported among studies.

