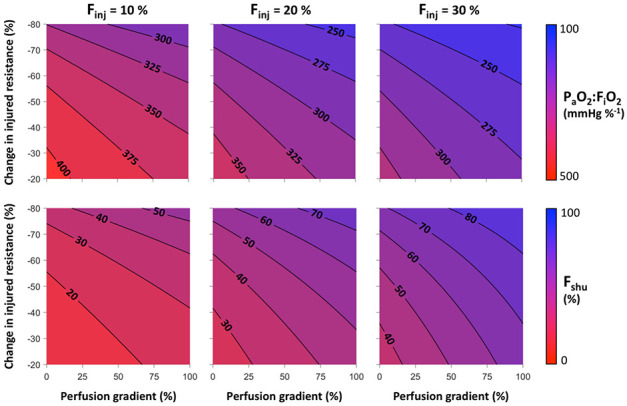
Figure 3.

Hypoxia severity maps with respect to perfusion gradient and percent change in vascular resistance within the injured compartment of the lower lung zone. Top row shows contours of the ratio of arterial oxygen tension to inspired oxygen fraction (PaO2:FiO2). Bottom row shows contours of the shunt fraction (Fshu). Columns represent different levels of the fraction of lung injured (Finj).
