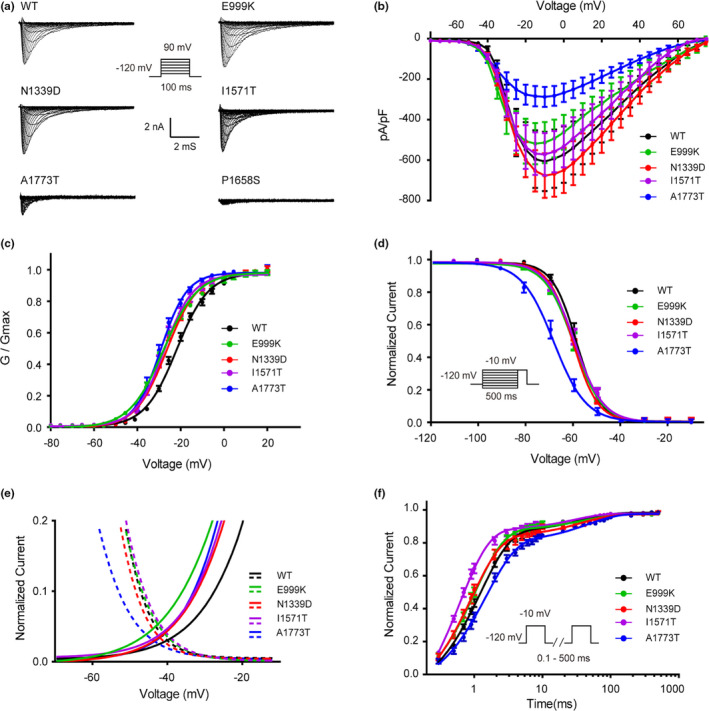
FIGURE 2.

Epilepsy‐associated mutations alter the function of the Nav1.2 channel. (a) Representative whole‐cell patch‐clamp traces of voltage‐dependent currents recorded from HEK293T cells transfected with either Nav1.2 wild‐type or mutant channels. Cells were held at −120 mV and sodium currents were evoked by a series of depolarizing pulses (100 ms) to potentials ranging from −80 mV to +90 mV in steps of 5 mV (inset). (b) Normalized I‒V curves of peak sodium current density (in pA/pF) versus voltage for WT and mutations. (c) Voltage dependence of activation obtained by plotting the normalized conductance against test potentials with equation G/Gmax = 1/(1 + exp(V0.5 − V)/k, where the Gmax is the maximum conductance, V0.5 is the half‐maximal activation potential and k is the slope factor. the curve is fitted to a Boltzmann function. (d) Steady state of fast inactivation of WT and mutant Nav1.2 channels. The voltage dependence of fast inactivation was assessed by applying a double‐pulse protocol: 500‐ms prepulses were applied from −150 to 0 mV in steps of 10 mV and followed by a test pulse to −10 mV (inset). The steady‐state fast inactivation curve was fitted by the Boltzmann equation (I/Imax = {1 + exp[(V − V0.5)/k]} − 1). (e) Window currents of WT the mutations. Activation curves (fraction of maximum conductance, G/Gmax) and steady‐state inactivation (fraction of maximum current, I/Imax) of WT and the mutations are enlarged and plotted together to show the window currents. (f) The time course of recovery from fast inactivation. Recovery from fast inactivation was assessed by a two‐pulse recovery protocol with varying time intervals between a 500‐ms inactivating prepulse and a test pulse to −10 mV (inset). The time course of recovery from inactivation was fitted with a double‐exponential function to generate τ1 and τ2. All fitting results are listed in Table 1. Data are presented as the mean ± SEM
