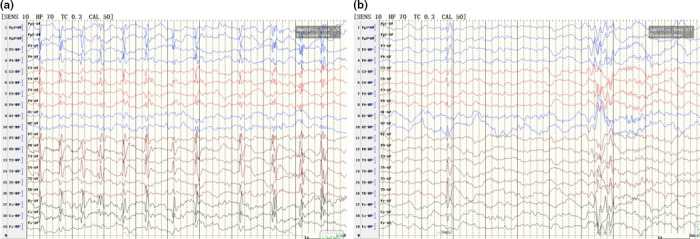
FIGURE 2.

(a) Electroencephalography (EEG) in the proband showed spike and slow waves in the right rolandic area during sleep, with a discharge index of 60% in non‐rapid eye movement sleep (NREM) (electrical status epilepticus during slow‐wave sleep [ESES]). (b) EEG findings in the brother showed spike and slow waves in the right rolandic area during sleep
