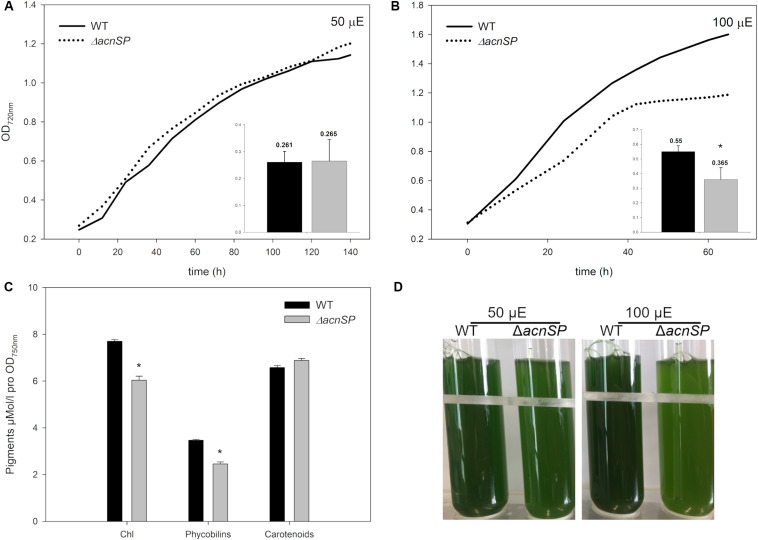
FIGURE 4.
Characterization of mutant ΔacnSP. (A) Growth experiment with the WT and the mutant grown under continuous light of 50 μE or (B) 100 μE. The growth as increase in OD720 is shown from one representative experiment. The inserts show calculated growth rates per day of the WT (black columns) and the mutant (gray columns) (mean and standard deviation from three growth experiments). (C) Estimation of pigment contents in cells of the WT and mutant ΔacnSP grown at 100 μE continuous light. (D) Appearance of the WT and mutant ΔacnSP grown at 50 or 100 μE continuous light for 48 h. The asterisks mark statistically significant differences between the WT and mutant (Student’s t-test, P-value < 0.01).

