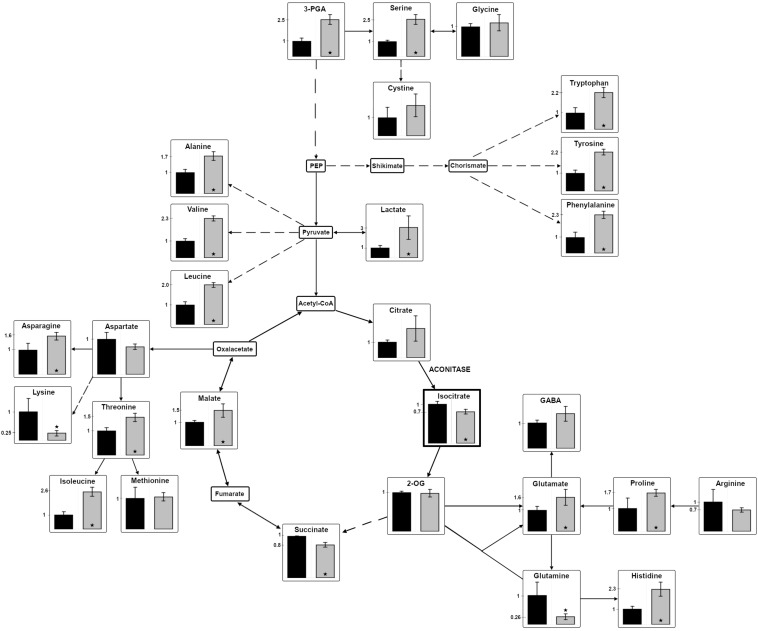
FIGURE 5.
Changes in the relative abundances of metabolites in the mutant ΔacnSP. Polar low molecular mass metabolites were isolated from cells of the mutant ΔacnSP or the WT, which were cultivated at continuous light of 100 μE for 48 h. Metabolites of the central carbon and nitrogen metabolism were quantified by LC-MS/MS in extracts of the mutant ΔacnSP (gray columns) or the WT (black columns) of Synechocystis 6803. Only isocitrate was quantified by an enzymatic assay (indicated by the thicker frame). The relative amount of the metabolite in WT cells was set to 1 and fold changes of mutant metabolite levels are displayed. The relative metabolite abundance can be found in the Supplementary Table S2. Broken arrows indicate that more than one enzymatic step is necessary for the conversion of certain metabolites. Asterisks indicate statistically significant differences (Student’s t-test, P-value ≤ 0.05) (2-OG – 2-oxoglutarate; 3PGA – 3-phosphoglycerate; GABA – γ-aminobutyric acid; PEP – phosphoenolpyruvate).

