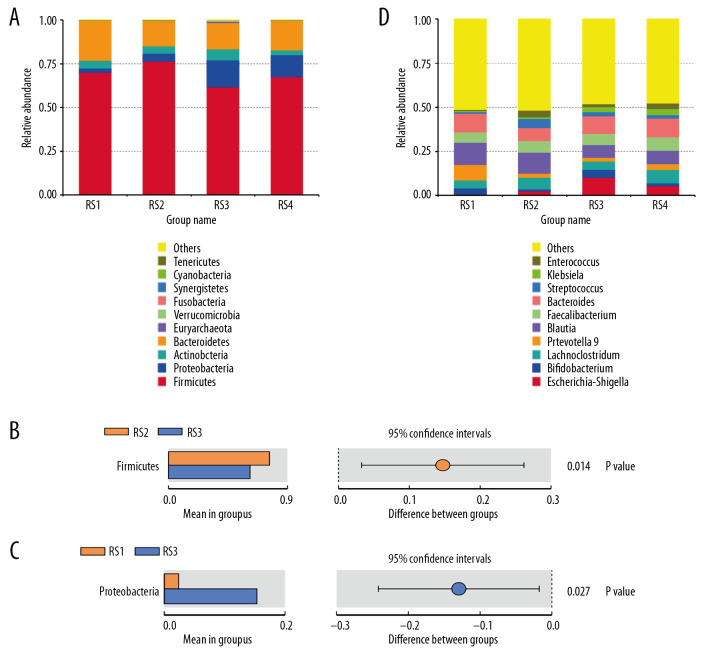
Figure 1.
Bar charts of the relative abundance of the fecal microbiota species at the phylum level. According to the annotation results of the microbial species, the most abundant species of each group at the phylum level are selected to generate the bar chart of the relative abundance of species. The x coordinate represents the name of the groups. The y coordinate represents the relative abundance. (A) RS1: the healthy control group; RS2: the stage 5 chronic kidney disease (CKD) normal diet group; RS3: the stage 5 CKD very low-protein diet group; RS4: the stage 5 CKD low-protein diet group. (B) The t-test analysis chart of the species difference between the groups. There are significantly fewer Firmicutes in the RS3 group than in the RS2 group. (C) The t-test analysis chart of the species difference between the groups. There are significantly more Proteobacteria in the RS3 group than in the RS1 group. (D) Bar chart showing the relative abundance of the species at the genus level.

