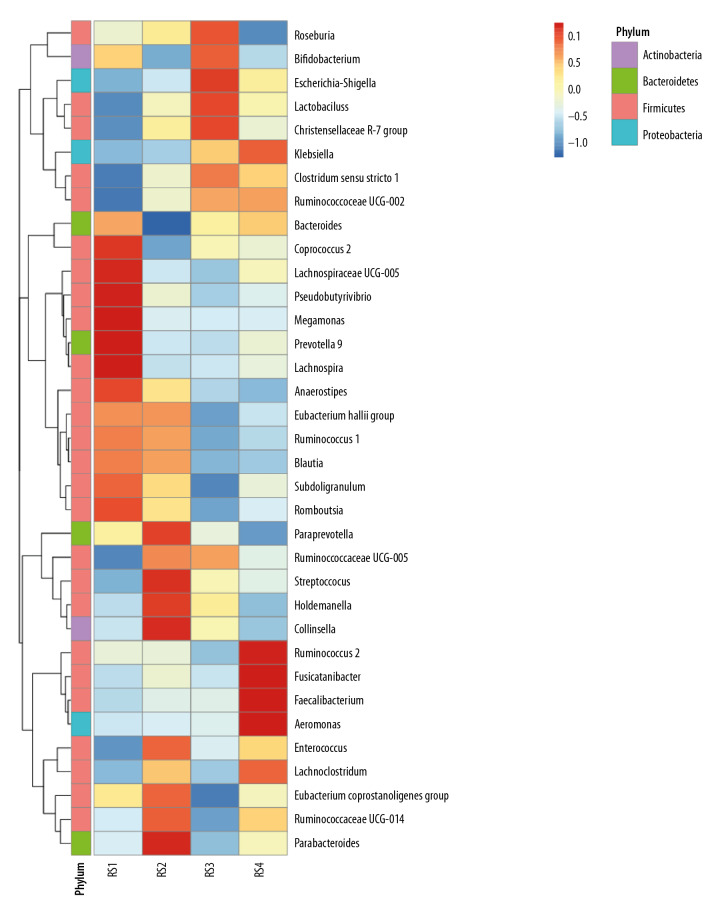
Figure 2.
Analysis of species abundance clustering in the heat map. The longitudinal axis shows the sample information, the transverse axis represents the species annotation information, and the clustering tree on the left of the figure is a species clustering tree. The cluster tree above is the cluster tree between the sample groups. The value corresponding to the intermediate heat map is the z-value obtained after standardization treatment for the relative abundance of species in each row. The z-value of a sample in a certain classification is the value obtained by dividing the difference between the relative abundance of samples in that classification and the average relative abundance of all samples in that classification by the standard deviation (SD) of all samples in that classification.

