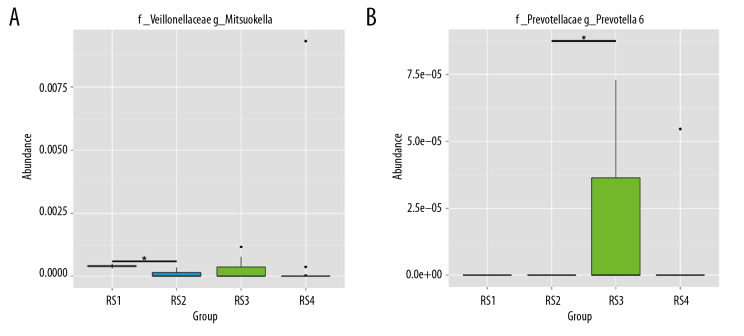
Figure 3.
Sequencing and identification of the rat intestinal microbiota. The sample group is shown on the x-axis. The relative abundance of the corresponding species is shown on the y-axis. * Indicates a significant difference between the two groups (P<0.05), and ** indicates a significant difference between the two groups (P<0.01). (A) At the genus level, the Mitsuokella content was highest in the RS3 group. (B) The content of Prevotella was highest in the RS3 group.

