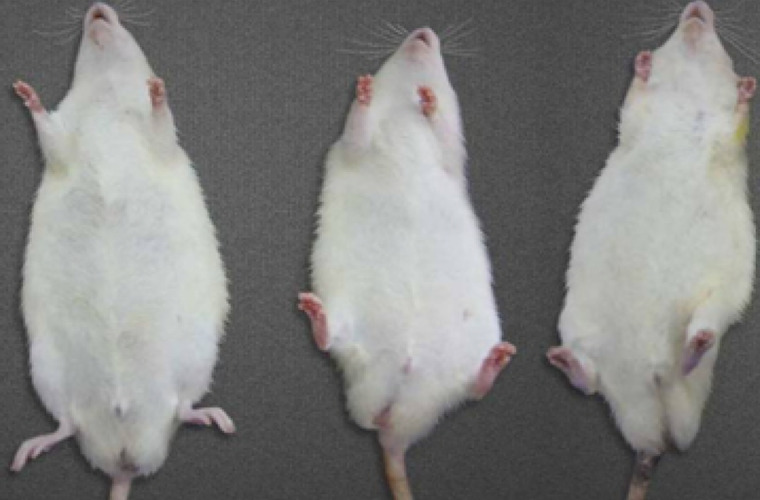
Figure 6.

Comparisons of the weight in the three rat groups following human to rat fecal microbiota transplantation. The three rat groups were compared, the control group (CG), the uremia patient fecal microbiota transplantation group (EG1), and the normal human fecal microbiota transplantation group (EG2).
