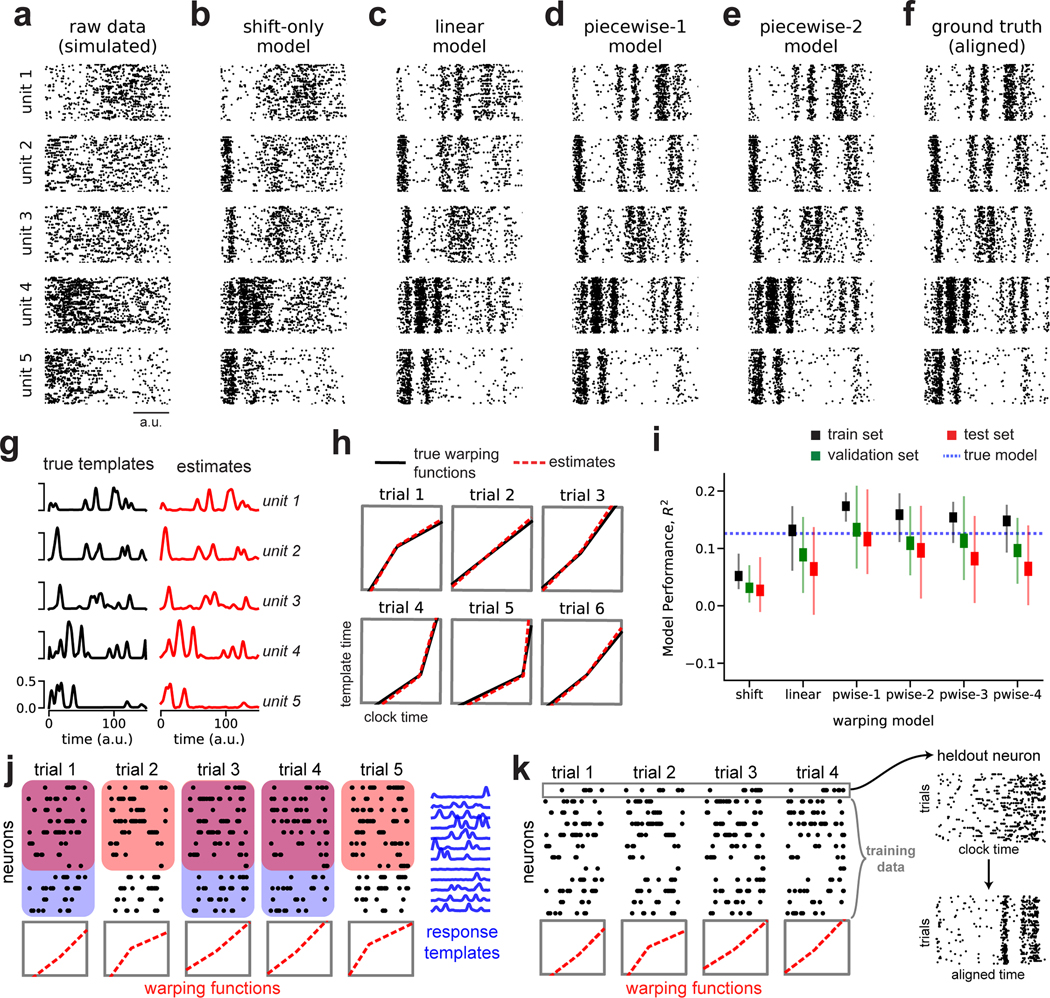
Fig 2. Recovery of ground truth warping functions in synthetic data.
(A) Synthetic spiking data from N = 5 units, T = 150 timebins, and K = 75 trials. Data were simulated from a ground truth model with piecewise linear warping functions with 1 knot. (B) Data re-aligned by a shift-only warping model. (C) Data re-aligned by a linear warping model. (D) Data re-aligned by a piecewise-linear (1-knot) warping model. (E) Data re-aligned by a piecewise-linear (2-knots) warping model. (F) Data re-aligned by the ground truth model. Note similarity with panels D & E. (G) Ground truth neural response templates (black) and estimated response templates (red) from the piecewise-linear (1-knot) model. Y-axis denotes the probability of spiking in each time bin. (H) Ground truth warping functions (black) on six representative trials, and estimated warping functions (red) from the piecewise-linear (1-knot) model. (I) Model performance (R2) in training, validation, and test partitions of various warping models. Thin lines represent maximum and minimum values; thick lines represent mean ± standard error. Results were computed over 40 randomized cross-validation runs. The horizontal dashed blue line reflects the performance ceiling on held out data achieved by the ground-truth model. (J) Cross-validation procedure (see Methods). On each trial, the warping functions are fit to a subset of neurons (red boxes). For each neuron, the response templates are fit to a subset of the trials (blue boxes). The training set refers to the overlap of these two regions (purple overlap). The validation and test sets are subsets of the remaining data (uncolored white regions). (K) Validation procedure for single-neuron raster plots. The visualized neuron is held out; the warping functions are fit to the remaining neurons and then applied to the held out cell.

