Figure 2.
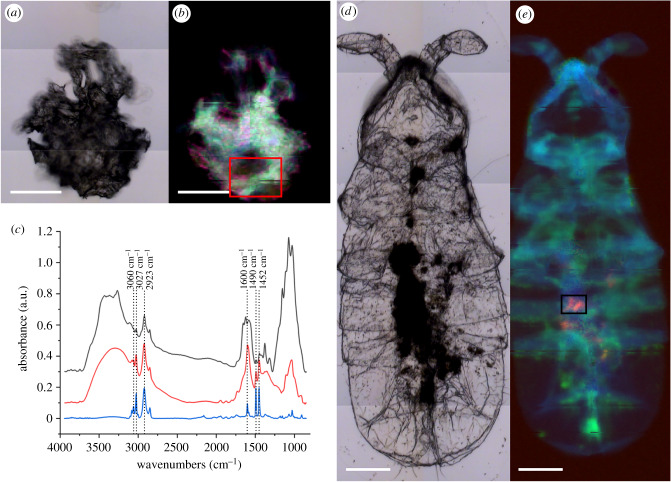
Detection of PS traces in Antarctic collembolans. (a) PS fragment from positive control measured by μ-FTIR. (b) RGB image showing spectral regions of lipids (blue, 3000–2800 cm−1), proteins (green, 1700–1500 cm−1) and PS (red, peak at 1490 cm−1). The red square indicates the pixels averaged to obtain the red spectrum in (c). (c) Comparison between PS average spectra inside the collembolan (black line), hydrated PS from the positive control (red line) and PS fragment after drying (blue line). The vertical lines identify the characteristic peaks of PS. Spectra are offset vertically for clarity. (d) Collembolan analysed by μ-FTIR. (e) RGB image showing spectral regions of lipids (blue), proteins (green) and PS (red). The black rectangle indicates the pixels averaged to obtain the black spectrum in (c). Scale bars: 100 µm.

