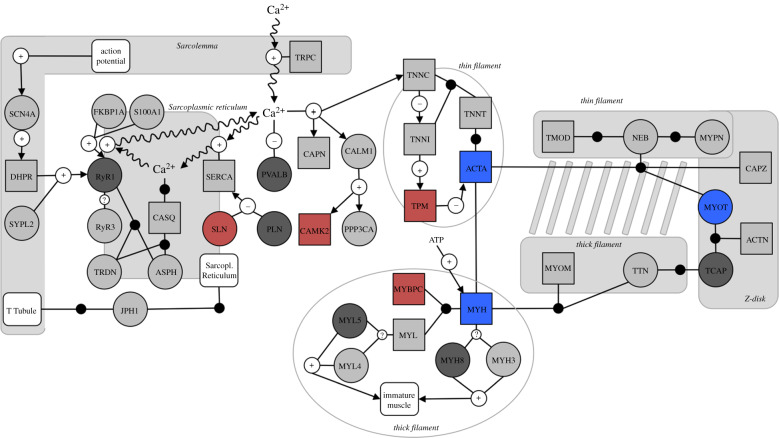
Figure 2.
Expression changes in targeted skeletal muscle contraction pathways. Symbols represent genes (circles), gene complexes (squares), modules or functions (white squares), interactions (white circles; positive, negative or unknown) and binding (black circles) per [29]. Colours indicate upregulation (blue), downregulation (red) or no change (light grey) in the cold, or not present in the dataset (dark grey). See electronic supplementary material, table S7 for complete pathway details.

