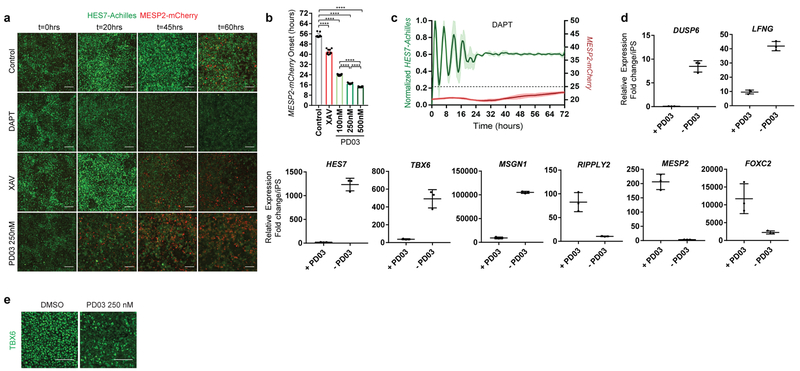
Extended Data Figure 7.
a, Snapshots of HES7-Achilles; MESP2-mCherry double reporter cells on days 2-5 of differentiation in CLFBR medium at 0, 20, 45 and 60 hours. Cultures treated with DMSO (control), 25μM DAPT, 2μM XAV and 250nM PD03 are shown. n=10. Scale bar = 100μm. b, Time of MESP2-mCherry expression onset in human iPSC-derived PSM cells treated with vehicle control (DMSO), 2μM XAV, 250nM PD17 or 100nM/250nM/500nM PD03. Expression onset defined by threshold (25 a.u.). Mean ±SD. One-way ANOVA: control vs. XAV p=4.6e−15, control vs. 100nM PD03 p=5.1−17, control vs. 250nM PD03 p=1.3e−17, control vs. 500nM PD03 p= 1.4e−18, 100nM vs. 250nM PD03 p=2.6e−15, 100nM vs. 500nM PD03 p=7.7e−16, 250nM vs. 500nM PD03 p=6.9e−5. n=10. c, HES7-Achilles and MESP2-mCherry fluorescence intensity profiles in small regions of interest within human iPSC-derived PSM cultures treated with 25μM DAPT on days 2-5 of differentiation in CLFBR medium. Mean ±SD. Dotted line denotes threshold for MESP2 activation (25 a.u.). n=15. d, qRT-PCR for the genes HES7, LFNG, MSGN1, TBX6, DUSP6, FOXC2, MESP2 and RIPPLY2 in human iPSC-derived PSM cultures treated for 24 hours with either vehicle control (DMSO) or 250nM PD03 in CLFBR medium. Relative expression shown as fold change relative to iPS (day 0). Mean ± SD. n=3 e, Immunofluorescence staining for TBX6 on day 3 of differentiation (CLFBR medium) in cells treated with either DMSO or PD03 (250 nM). n=4 independent experiments. Scale bar = 100μm.

